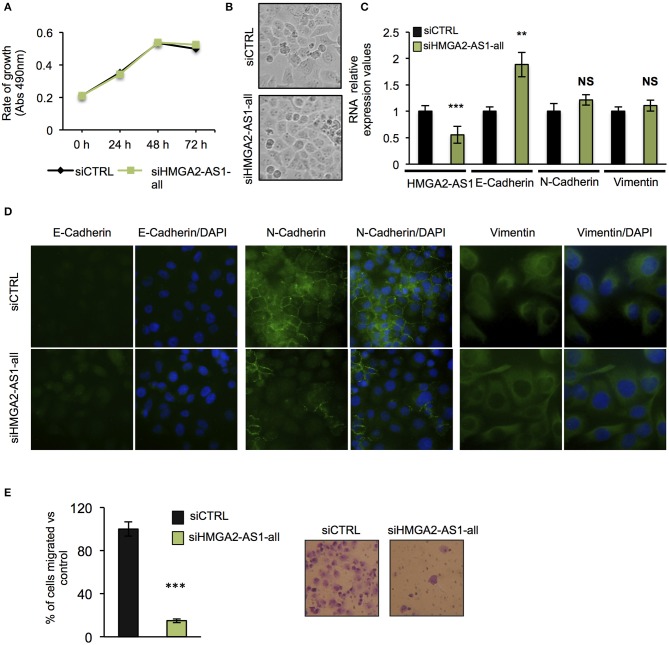
Figure 5.
Natural antisense lncRNAs from HMGA2-AS1 locus are involved in cancer promotion. (A) MTS proliferation assay in PANC1 cells silenced or not for HMGA2-AS1 transcript variants with siHMGA2-AS1-all. The data are presented as mean ± SD (n = 4). (B) Representative pictures of cell morphology of PANC1 cell culture in control condition and after 72 h of siHMGA2-AS1-all transfection. (C) qRT-PCR analysis of HMGA2-AS1, E-Cadherin, N-Cadherin, and Vimentin after 72 h of siHMGA2-AS1-all silencing in PANC1 cell line. Primers used to detect HMGA2-AS1 amplify together A2-AS1_A, A2-AS1_G, and A2-AS1_I. GAPDH was used for normalization. The data are compared to siCTRL and are presented as the mean ± SD (n = 3), **p ≤ 0.01, ***p ≤ 0.001; two-tailed Student's t-test. (D) Representative immunofluorescence images of the epithelial marker E-Cadherin and the mesenchymal markers N-Cadherin and Vimentin localization in PANC1 control cells vs. cells silenced with siHMGA2-AS1-all. Images were taken at 40× magnification for E- and N-Cadherin and at 60× magnification for Vimentin. (E) Transwell assay of PANC1 cells silenced with siHMGA2-AS1-all for 72 h. On the left, quantification of the transwell assay. The data are represented as the mean of percentage of migrated cells respect to siCTRL ± SD (n = 4), ***p ≤ 0.001; two-tailed Student's t-test. On the right, representative images of cells migrated across the porous membrane, stained with crystal violet.

