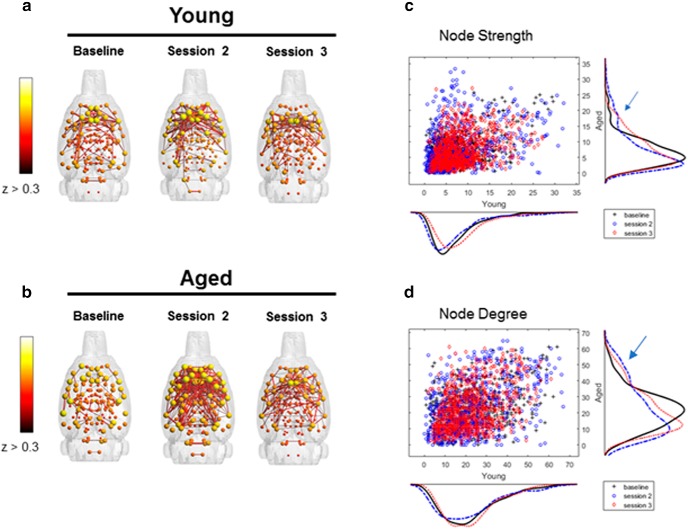
Figure 3.
Connectivity patterns by scanning session and age group. a, b, Connected modules with edges z > 0.3 for young (a) and aged (b) rats across scan sessions. Connectivity indices indicate larger network engagement between baseline and the second and third scanning sessions in aged rats (blue arrow), but not young rats. c, d, This is indicated by more nodes with node strength >15 (c) and node degree >40 (d).

