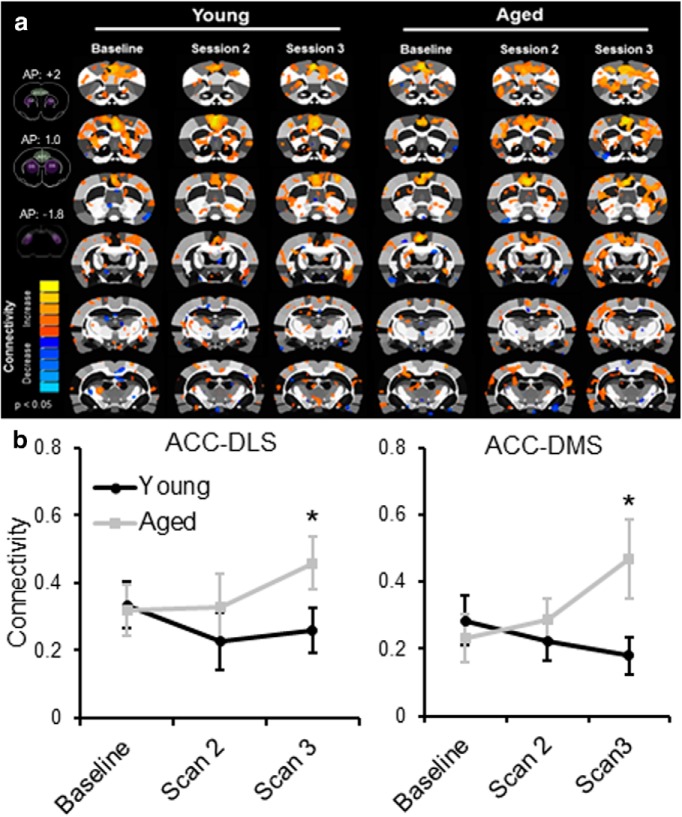
Figure 5.
Seed analysis of ACC connectivity. a, Connectivity with ACC in young (left) and aged (right) rats as a function of scan session. The insets on the left show the locations of the ACC (green shaded) and DS (purple shaded) for bregma locations anterior to posterior +2 to −1.8. b, Connectivity between the ACC and DS as a function of scan session for the lateral (left) and medial (right) subregions in young (black) and aged (gray) rats. The main effects of scan session (F(2,64) = 1.69, p = 0.19), age (F(1,32) = 3.67, p = 0.07), and subregion of the striatum (F(1,32) = 1.15, p = 0.29) did not reach statistical significance. The interaction effect between age and scan session was significant, however (F(2,64) = 3.75, p = 0.03). Post hoc analysis indicated that there were no significant age differences between ACC–DS connectivity during the baseline scan (p = 0.63) and scan 2 (p = 0.26), but the aged rats had significantly higher connectivity relative to young rats during the third scan (p = 0.004). Error bars are ± 1 SEM, *p < 0.05.

