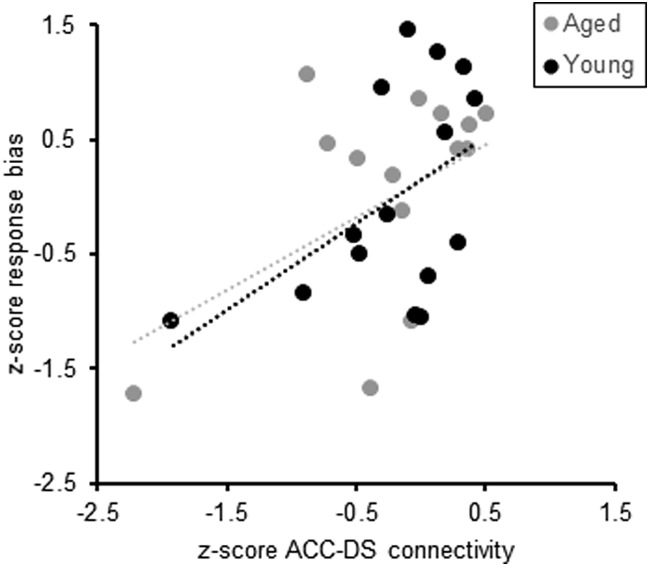
Figure 6.

Response bias and ACC–DS connectivity. Across the three scanning sessions, the mean response bias of individual rats measured during behavior significantly correlated with ACC–DS connectivity (R(29) = 0.48, p = 0.008), such that more connectivity corresponded with a higher proportion of trials in which this aberrant strategy was used. Dashed lines indicate the line of best fit for young (black) and aged (gray) rats.
