Figure 2.
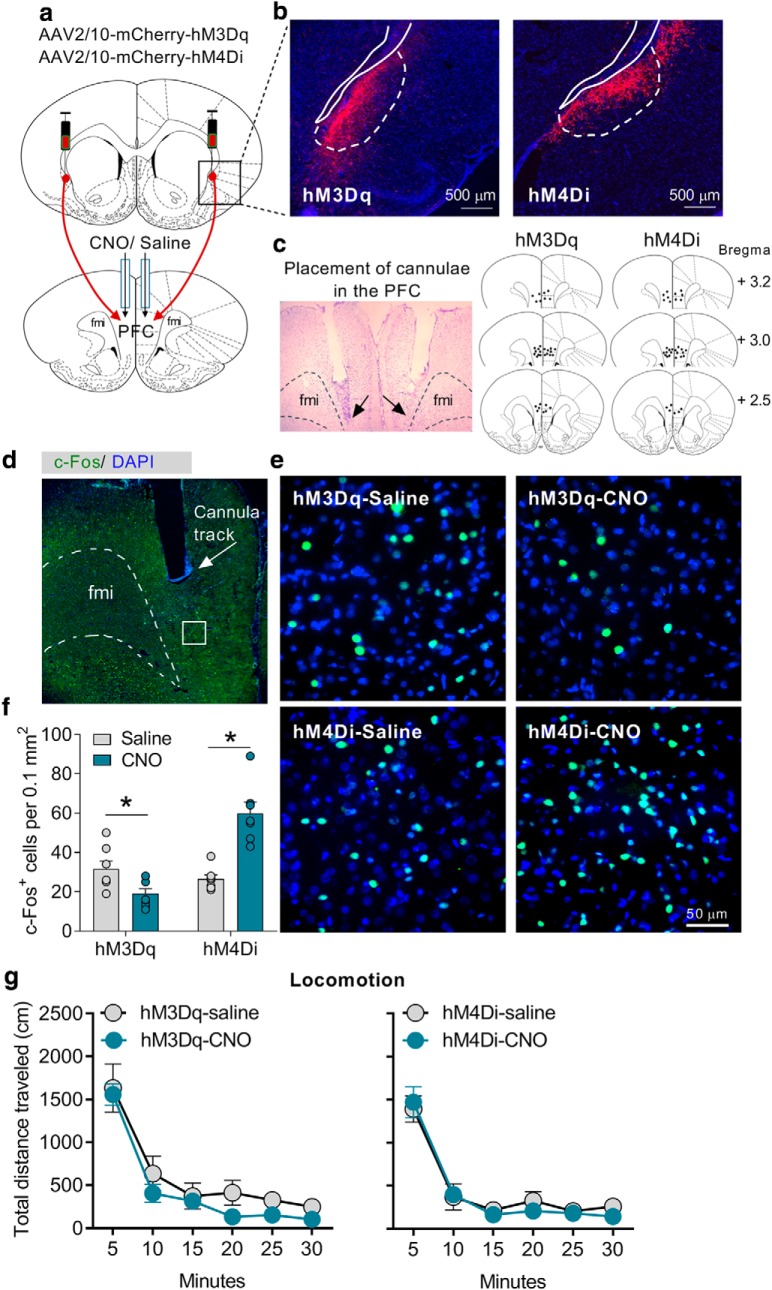
Chemogenetic modulation of the CLA–PFC pathway did not affect locomotion. a, Representative figure showing chemogenetic modulation of the CLA–PFC pathway. b, Representative figures showing expression of hM3Dq-mCherry and hM4Di-mCherry in the CLA. c, Brain atlas showing microinjection sites. d, Representative figure showing cannulae placement and c-Fos expression in the PFC under low magnification (4× objective). e, Representative figures of c-Fos expression of different groups of rats under high magnification (20× objective). f, Chemogenetic activation and inhibition of the CLA–PFC pathway reduced and increased the number of c-Fos-positive cells in the PFC, respectively. g, Chemogenetic activation or inhibition of the CLA–PFC pathway did not affect locomotion. Data were presented s mean ± SEM n = 7/group. *p < 0.05, compared with saline group.

