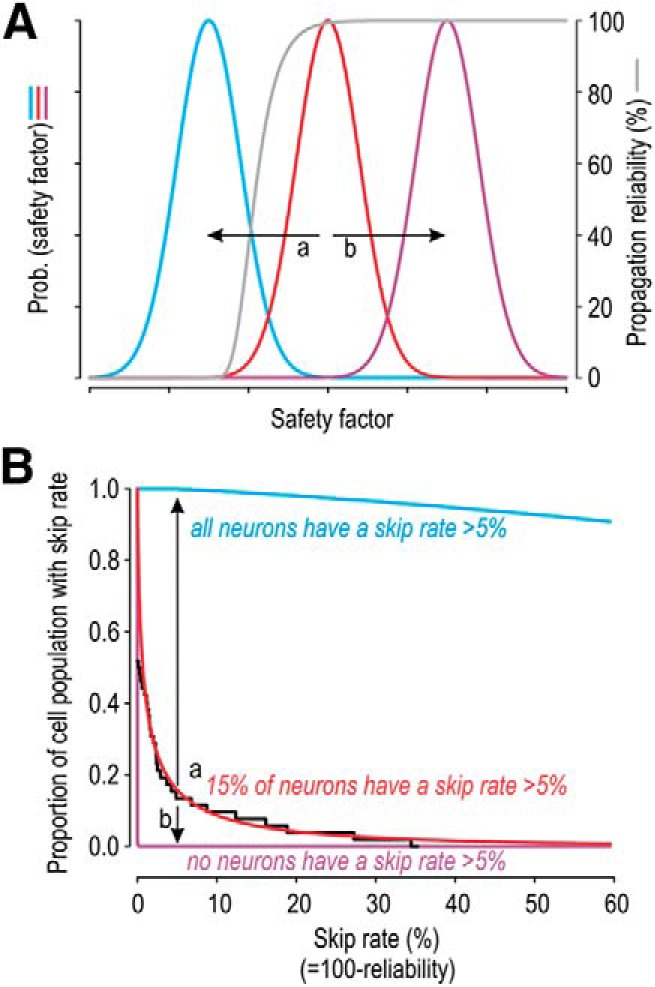
Figure 9.

Theoretical relationship between safety factor and propagation reliability. A, Gray curve indicates propagation reliability as a function of safety factor. Colored curves indicate the variation in safety factor across three separate populations of cells. B, Convolving the gray curve with the cumulative probabilities corresponding to each colored curve (in A) yields the proportion of cells exhibiting different skip rates. Reliability is high for all purple cells but is low for all blue cells (i.e., the skip rate is uniformly low or high, respectively). In contrast, for cells shown in red, 15% of the population have a skip rate >5% (which produces conspicuous integer-multiple-patterned spiking), but most cells are very reliable. Data from Figure 3C (shown in black) are well fit by the red curve. Relative to the red distribution, a small reduction in safety factor (arrow a) dramatically reduces propagation reliability, whereas a small increase (arrow b) conveys little improvement, therein showing that an optimal solution is achieved by using a safety factor near the elbow of the gray curve.
