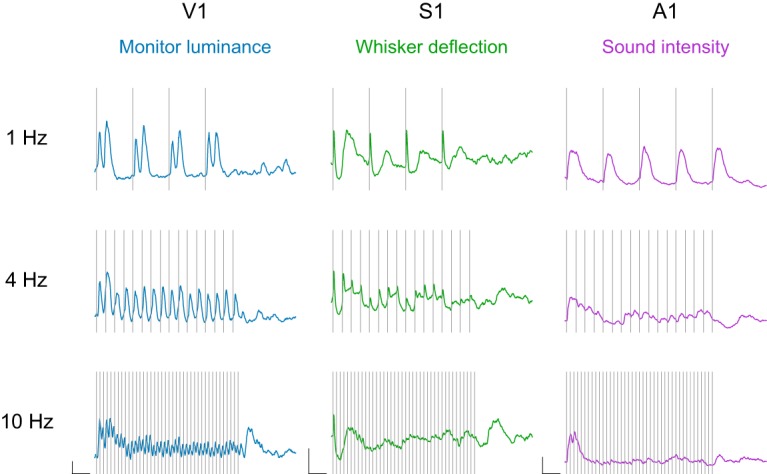
Figure 1.

Fixed-interval stimulus responses across sensory cortex. Example V1 (blue), S1 (green), and A1 (purple) membrane potential responses to fixed-interval stimuli delivered at 1, 4, and 10 Hz. Calibration: y axis, 5 mV change in membrane potential; x axis, 500 ms duration. Gray bars represent an individual pulse in the stimulus train.
