
Figure 8.
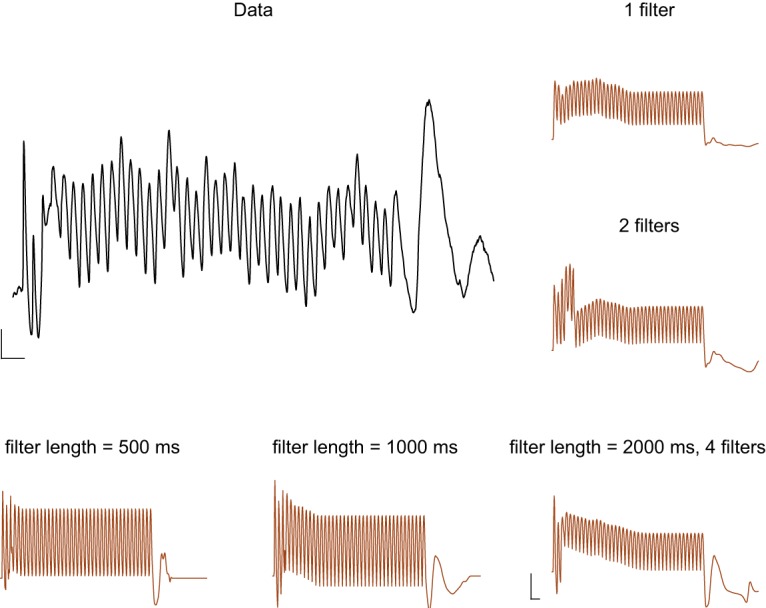
Impact of model parameters of response properties. Model simulations (brown) generated by changing the number of filters (right column) and the filter length (bottom row). Data are shown in black. Calibration: x axis, 250 ms; y axis, 2 mV.
Official websites use .gov
A
.gov website belongs to an official
government organization in the United States.
Secure .gov websites use HTTPS
A lock (
) or https:// means you've safely
connected to the .gov website. Share sensitive
information only on official, secure websites.
Impact of model parameters of response properties. Model simulations (brown) generated by changing the number of filters (right column) and the filter length (bottom row). Data are shown in black. Calibration: x axis, 250 ms; y axis, 2 mV.