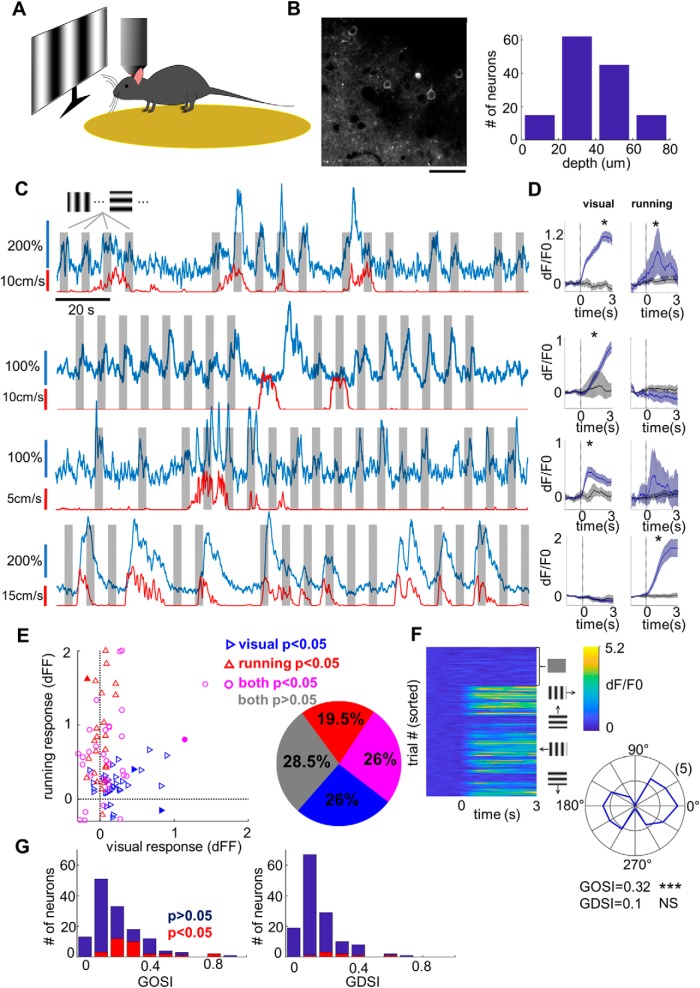
Figure 1.
Visual responsiveness of L1 neurons. A, Schematic illustration of the experimental setup. B, Left, An example imaging region. Scale bar, 50 μm. Right, Histogram showing the depth distribution of imaged cells, divided into four evenly spaced bins between 0 and 80 μm. The counts in the four bins are 15, 62, 45, and 15 cells, respectively (n = 137 cells across five animals). C, GCaMP6 fluorescence traces (blue, 3 min long) from four example neurons. Gray patches mark the 3-s-long visual stimulation, while the red trace below indicates the speed of locomotion. D, Mean fluorescence traces (blue) aligned to the onset of visual stimulation (left) or the onset of locomotion (right). The gray trace shows the control condition, which is different for visual stimulation and running (see Materials and Methods). Shaded regions represent the 95% confidence intervals (bootstrap). *p < 0.05 (rank-sum test). E, Left, Mean locomotion response versus mean visual response for significantly activated neurons. Blue triangles mark cells with significant response to visual stimuli. Red triangles mark cells with significant response to locomotion onset. Magenta circles mark cells that show significant responses under both conditions. Filled symbols correspond to the four example neurons shown in C. Right, Pie chart showing proportions of nonresponsive neurons (gray, 28.5%), exclusively visually responsive neurons (blue, 26%), exclusively locomotion-responsive neurons (red, 19.5%) and neurons responding to both visual stimuli and locomotion (magenta, 26%). F, Characterization of orientation and direction selectivity for an example neuron. Left, Individual dF/F0 traces aligned to the onset of the visual stimuli. The top quarter of traces correspond to the control condition with blank stimulus. The bottom three-quarters of traces are sorted by grating orientation/direction (12 in total). Right, Polar plot showing response levels of the neuron to sinusoidal gratings at different orientations. The angle corresponds to the stimulus angle, while the radius is proportional to the response level at a given orientation. For this cell, GOSI = 0.32 (***p < 0.0001, permutation test) and GDSI = 0.1 (NS, not significant, p = 0.11, permutation test). G, Orientation (left) and direction (right) selectivity across 137 imaged neurons. Cells with significant orientation selectivity or direction selectivity (p < 0.05) are highlighted in red. In total, 32 of 137 cells (23.4%) were significantly orientation selective, while only 8 of 137 cells (5.8%) were significantly direction selective.

