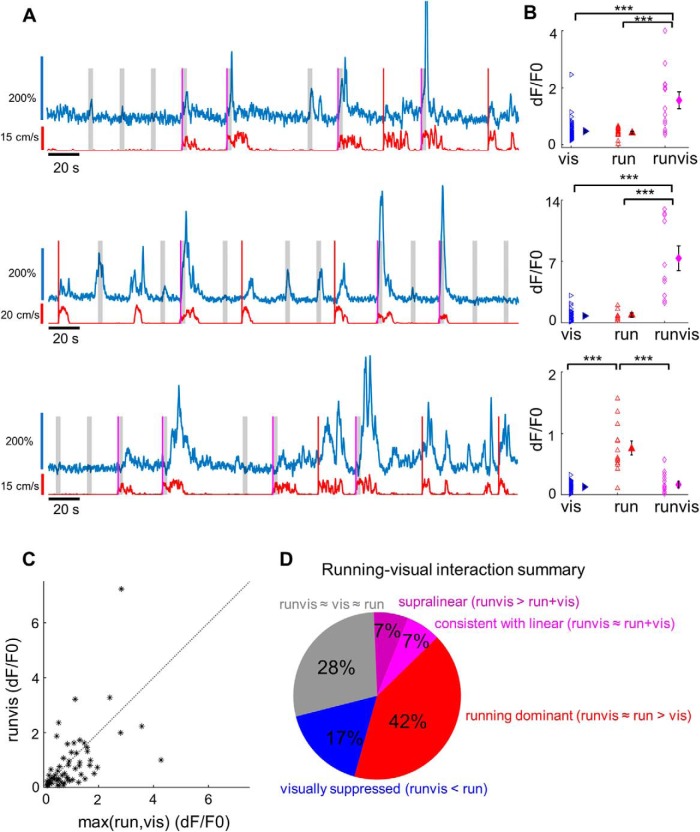
Figure 2.
Interactions between visual and locomotion responses in L1. A, Fluorescence traces for three example L1 neurons. Red lines denote running-evoked events during which the screen remained blank, while magenta lines denote running-evoked events that triggered a 3-s-long visual stimulus (marked by the gray-shaded area). B, Comparison of maximum fluorescence transients following visual stimulation (blue triangles), locomotion (red triangles), or visual stimulation during locomotion (magenta diamonds), for cells shown in A. In the first two neurons, the visual responses during locomotion are significantly higher than either visual responses alone or the locomotion responses alone (p < 0.0001, Kruskal–Wallis test followed by Dunn's multiple-comparisons test). In the third neuron, responses to locomotion alone are stronger than responses to locomotion accompanied by visual stimuli (p < 0.0001, Kruskal–Wallis test, Dunn's multiple-comparisons test; p < 0.0001, vis vs run; p = 0.997, vis vs runvis; p = 0.0004, run vs runvis). We classify such neurons as visually suppressed neurons. *** denotes p < 0.001. C, The average response to visual stimuli presented during locomotion (runvis condition) plotted against the average response to the onset of running (run) or the average response to visual stimuli (vis), whichever is higher (n = 60 neurons across four animals). Only neurons with sufficient sample size for all three conditions (8+ data points) were included in the analysis. D, Pie chart summarizing running–visual interactions. The 60 cells were classified based on how visual responses during running (runvis) compared with visual-only (vis) and running-only (run) responses. In 17 of 60 cells (28%, gray), the runvis condition did not differ significantly from either the run or vis condition (runvis vs run, p > 0.05; runvis vs vis, p > 0.05; Kruskal–Wallis test followed by Dunn's multiple-comparisons post hoc test). In 8 of 60 cells (13.3%, purple and magenta), runvis responses were stronger than either run or vis responses alone. In six of these cells, the runvis response was higher than both the run and vis response (runvis vs run, p < 0.05; runvis vs vis, p < 0.05; Kruskal–Wallis test followed by Dunn's multiple-comparisons post hoc test). In two additional cells, runvis versus run did not quite reach significance due to multiple-comparisons correction (p < 0.07), but was significant under ANOVA followed by Bonferroni correction, and so we decided to include these cells. The eight cells were further subdivided based on whether the runvis response was consistent with the arithmetic sum of run and vis responses (four cells, magenta, “linear”; see Materials and Methods) or whether it was significantly higher than the sum (four cells, purple, “supralinear”). In 25 of 60 cells (42%, red), responses under the runvis condition did not differ significantly from the run condition, but both the runvis and run responses were significantly stronger than the vis response condition (runvis vs run, p > 0.05; runvis vs vis, p < 0.05; run vs vis, p < 0.05; Kruskal–Wallis test followed by Dunn multiple-comparisons post hoc test). In 10 of 60 cells (17%, blue), the runvis responses were significantly weaker than the run responses, indicating a suppressive effect of visual stimulation (runvis vs run, p < 0.05; runvis < run, Kruskal–Wallis test followed by Dunn's multiple-comparisons post hoc test).

