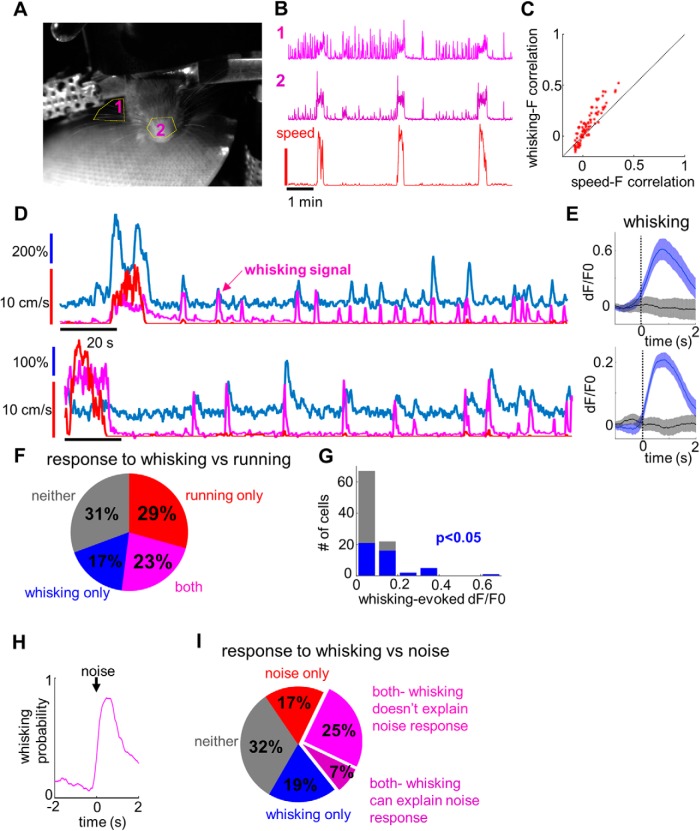
Figure 4.
Whisking-related activity in L1. A, Example video frame for whisking analysis, with analyzed ROIs shown in yellow. B, Example whisking traces acquired from the two ROIs, together with the corresponding locomotion trace (bottom). C, Whisker–dF/F0 correlation versus speed–dF/F0 correlation analyzed during quiescent periods. Note that while many whisking bouts are accompanied by minor movements during quiescence, the correlation between fluorescence and whisking is higher than that between fluorescence and speed. D, Example traces for two cells showing a high correlation between whisking activity (magenta trace) and fluorescence signal (blue). Note that some whisking-related fluorescence events happen in the complete absence of locomotion (red trace). E, Average fluorescence signals aligned to whisking events (blue) or in the control condition (black) for the cells shown in D. Shaded regions indicate 95% confidence intervals. F, Responses to whisking versus locomotion at the population level. Of 75 cells, 13 (17%) were responsive only to whisking, 22 (29%) only to locomotion, 17 (23%) to both whisking and locomotion, and 23 (31%) were not activated either during whisking or during locomotion. G, histogram summarizing mean evoked fluorescence changes following whisking events. Cells with significant whisking responses are highlighted in blue. H, Probability of whisking aligned to the onset of the noise burst. I, Responses to noise versus whisking at the population level. Of 84 neurons, 16 (19%) responded to whisking only, 14 (17%) responded to noise only, 27 (32%) responded to both whisking and noise, and 27 (32%) responded to neither. Among the neurons responding both to whisking and noise, whisking could explain the noise responses in 6 of 27 cases (purple), while in the remaining 21 cases the noise responses were too high to be accounted for by whisking (magenta).

