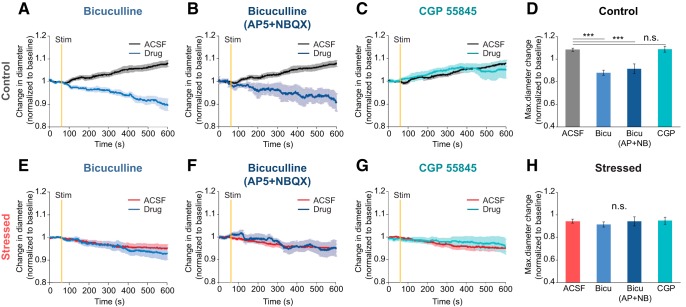
Figure 6.
Alteration of GABAA receptor-mediated vascular responses induced by 20 Hz focal electrical stimulation in stressed mice. A–C, E–G, Time course traces of arteriolar diameter change in control (A–C) and stressed brain tissues (E–G) exposed to two conditions: under ACSF circulation (black or red) or with treatment of drug (blue); 100 μm bicuculline, a GABAA antagonist (A, E), 100 μm bicuculline with glutamergic antagonists (10 μm AP5 + 5 μm NBQX) (B, F), and 10 μm CGP 55845, a GABAB antagonist (C, G) were used as drug circulation. D, Maximum diameter change amplitude in the control group following each drug treatment (ACSF: n = 10; bicuculline: n = 8; bicuculline with AP5 and NBQX: n = 5; CGP 55845: n = 7). H, Maximum diameter change amplitude in the chronically stressed group following each drug treatment (ACSF: n = 11; bicuculline: n = 8; bicuculline with AP5 and NBQX: n = 5; CGP 55845: n = 7). Data are mean ± SEM. ***p < 0.001, n.s., not significant. Statistical significance was tested with the one-way ANOVA followed by Bonferroni post hoc tests according to the results of a normal distribution test (Shapiro–Wilk test).

