Figure 6.
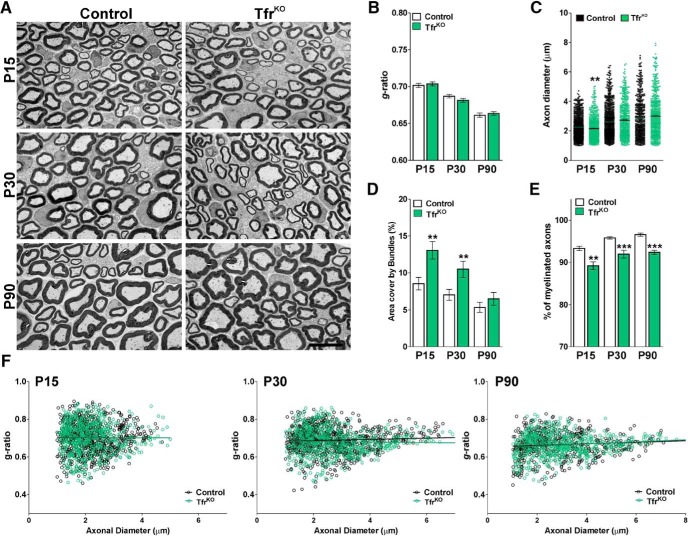
EM of the TfrKO sciatic nerve. A, Electron micrographs of axons in the sciatic nerve of control and TfrKO mice at different postnatal time points. Scale bar, 6 μm. B, Mean g-ratio values of control and TfrKO mice at P15, P30, and P90. C, Mean diameter of myelinated axons in control and TfrKO mice. D, Area cover by bundles of unmyelinated axons. E, Percentage of myelinated axons of control and TfrKO animals. F, Scatter plot of g-ratio values of control and TfrKO mice at P15, P30, and P90. Lines indicate the regression equation with 95% CIs. P15 Control: r2 = 0.0001; slope = 0.0004; 1/slope = −2474; F = 0.0118. P15 TfrKO: r2 = 0.0001; slope = 0.0001; 1/slope = 5427; F = 0.0826. P30 Control: r2 = 0.0034; slope = 0.0032; 1/slope = 306.4; F = 3.068. P30 TfrKO: r2 = 0.0008; slope = 0.0017; 1/slope = −586.5; F = 0.5552. P90 Control: r2 = 0.0091; slope = −0.0042; 1/slope = 237.0; F = 5.011. P90 TfrKO: r2 = 0.0170; slope = 0.0055; 1/slope = 179.5; F = 10.72. Data are mean ± SEM. Six sciatic nerves per genotype and 200 fibers in each sciatic nerve were analyzed. **p < 0.01; ***p < 0.001; versus respective controls.

