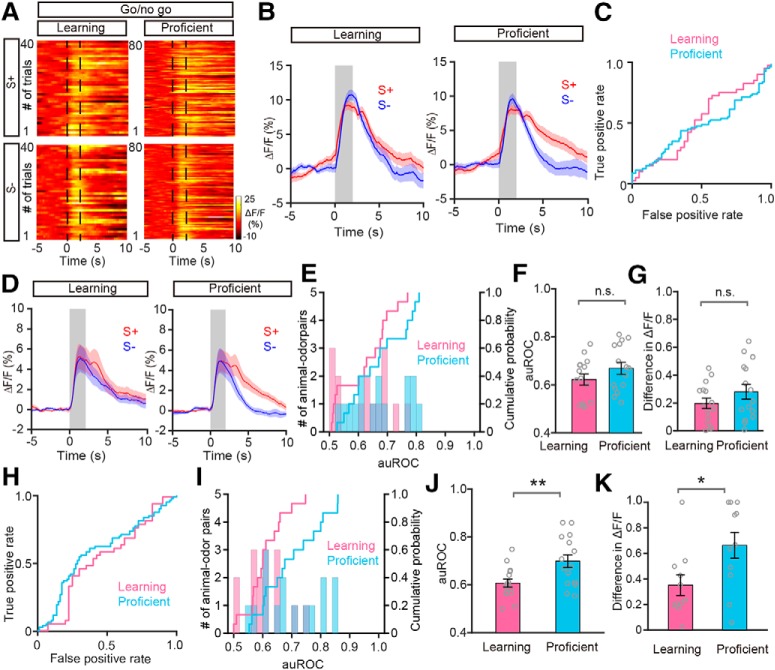
Figure 11.
Differentiation of odor responses in PPC pyramidal neurons during the go/no-go task. A–C, Heat maps (A), trial-averaged traces (B), and the ROC graph (C; 0–2 s) for the responses evoked by S+ and S− in the learning state and in the proficient state during the go/no-go task, from a representative mouse. D, Averaged odor-response traces across all animal–odor pairs (n = 15 animal–odor pairs from 7 mice). E, Histograms and cumulative probability of auROCs (0–2 s) in the learning state and in the proficient state during the go/no-go task across all animal–odor pairs. F, G, Comparison of auROCs (F; 0–2 s)/difference in ΔF/F (G; 0–2 s) between the learning state and the proficient state during the go/no-go task across all animal–odor pairs. F, Paired t test, n.s. (df = 14, t = −1.649); (G) paired t test, n.s. (df = 14, t = −1.888). H, The ROC graph (4–6 s) for the odor responses shown in B. I, Histograms and cumulative probability of auROCs (4–6 s) in the learning state and in the proficient state during the go/no-go task across all animal–odor pairs. J, K, Comparison of auROCs (J, 4–6 s)/difference in ΔF/F (K; 4–6 s) between the learning state and the proficient state during the go/no-go task across all animal-odor pairs. J, Paired t test, **p = 0.01 (df = 14, t = −3.001); (K) Wilcoxon's sign rank test, *p < 0.05 (z = −2.291).

