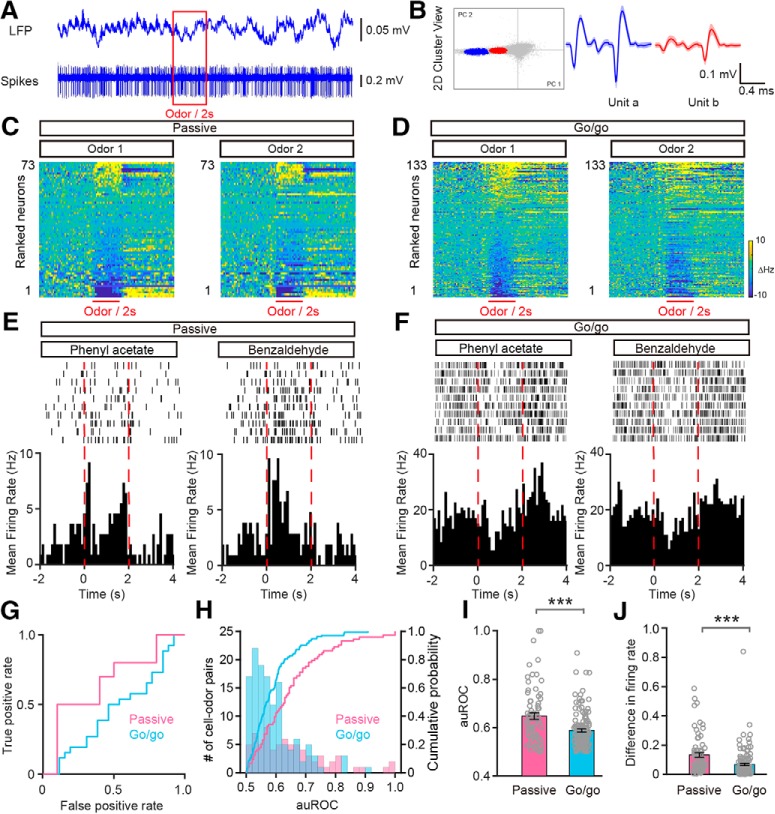
Figure 3.
Convergent odor-evoked firing in M/Ts in the go/go task. A, Example of raw traces of LFP and spikes from one odor stimulation trial. B, Example of spike sorting using PCA scan clustering of the extracellular voltage recorded by tetrodes, resulting in separation of two units (unit a, blue; unit b, red). C, D, Heat maps of firing rates averaged across all trials and further averaged across odorants for each neuron, ranked by mean odor-evoked firing rate, for odor1 in both the passive exposure (C; n = 73) and go/go task (D; n = 133) datasets. Odor1 and odor2 represent the two odors from the odor pairs. E, F, Example of firing induced by one odor pair (phenyl acetate vs benzaldehyde) during passive exposure (E) and in the go/go task (F). Top, raster plot. Bottom, PSTHs for the firing rate. The odor stimulation (2 s) is indicated by dashed red lines. G, The ROC graph for the M/T firing rates shown in A and B. H, Histogram and cumulative probability of the auROCs for all the cell–odor pairs under the passive exposure and the go/go task conditions. I, J, Comparison of auROCs (I)/difference in firing rate (J) between the passive exposure condition (n = 73 cell–odor pairs from 5 mice) and the go/go task (n = 133 cell–odor pairs from 10 mice). I, Mann–Whitney test, ***p < 0.0001 (z = −3.775); (J) Mann–Whitney test, ***p < 0.0001 (z = −4.439).

