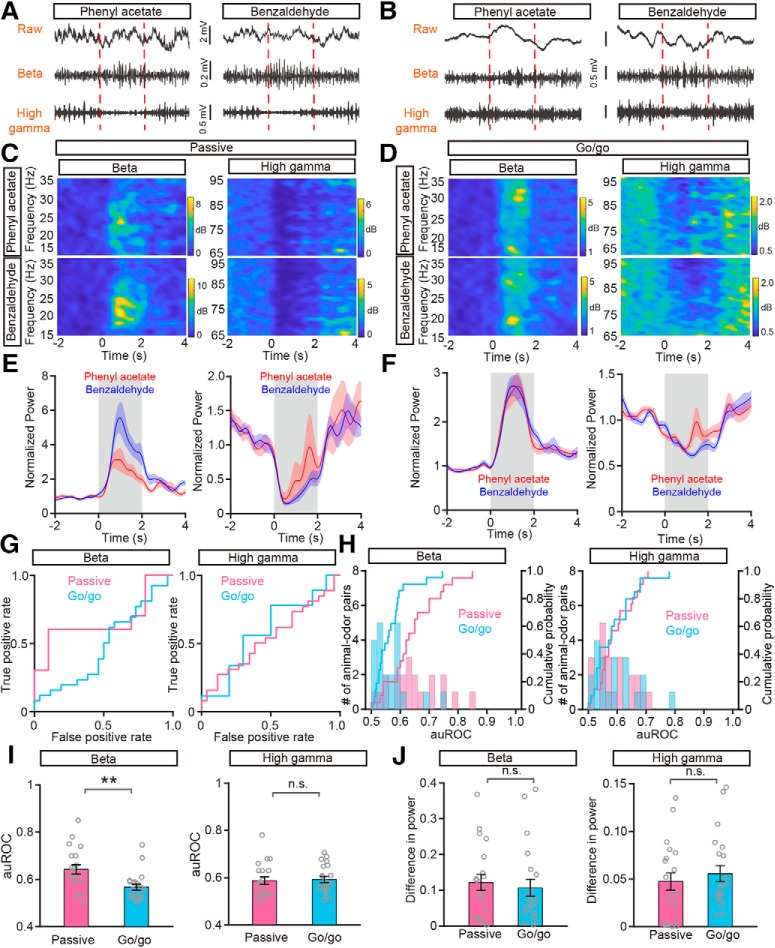
Figure 4.
Odor-evoked beta and high gamma responses under passive exposure and go/go task conditions. A, B, Raw traces (top) and filtered beta (middle) and high gamma (bottom) oscillations in the LFP signals in a representative mouse in respond to presentation of a pair of odors (phenyl acetate vs benzaldehyde) during passive exposure (A) and in the go/go task (B). C, D, Changes in the power spectrum elicited by the two odors under passive exposure (C) and go/go task (D) conditions for beta (top) and high gamma (bottom) oscillations. E, F, Averaged (across 10 trials) normalized traces for the beta (left) and high gamma (right) responses during passive exposure (E) and in the go/go task (F). Red and blue indicate the responses evoked by phenyl acetate and benzaldehyde, respectively. G, The ROC graphs for the beta (left) and high gamma (right) responses shown in E and F. H, Histograms and cumulative probability of the auROCs for beta (left) and high gamma (right) responses under passive exposure and go/go task conditions. I, J, Comparison of auROCs (I)/difference in power (J) for beta (left)/high gamma (right) responses under passive exposure (n = 20 animal–odor pairs from 5 mice) and in the go/go task (n = 21 animal–odor pairs from 10 mice). I, Mann–Whitney test, **p < 0.01 (z = −3.118) and n.s. (z = −0.613); (J) Mann–Whitney test, n.s. (z = −0.704) and n.s. (z = −0.861).

