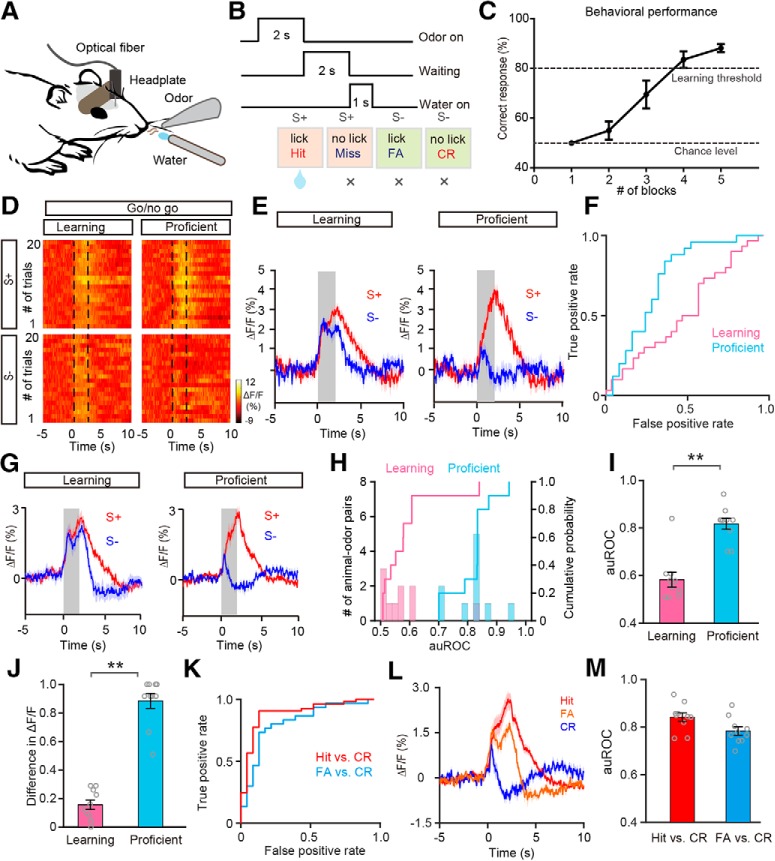
Figure 5.
Odor responses in the M/T population show improved differentiation after the mice learn to discriminate the odors in a pair in the go/no-go task. A, Diagram of the experimental paradigm. B, Schematic of the go/no-go task sequence. Odor was applied for 2 s, followed by 2 s waiting time, followed by delivery of the water reward. C, The odor discrimination performance during the go/no-go task across all the sessions recorded (n = 8 animal–odor pairs from 4 mice). The mean percentage correct responses across sessions are plotted for each block (20 trials). The chance level and learning threshold are indicated by dashed lines. D–F, Heat maps (D), trial-averaged traces (E), and the ROC graph (F) for odor responses induced by S+ and S− in the learning state and in the proficient state during the go/no-go task, from a representative mouse. G, Averaged traces of odor responses across all animal-odor pairs (n = 10 animal–odor pairs from 5 mice). H, Histograms and cumulative probability of auROCs in the learning state and in the proficient state during the go/no-go task across all animal–odor pairs. I, J, Comparison of auROCs (I)/difference in ΔF/F (J) between the learning state and the proficient state during the go/no-go task across all animal–odor pairs. I, Wilcoxon's sign rank test, **p < 0.01 (z = −2.807); (J) Wilcoxon's sign rank test, **p < 0.01 (z = −2.803). K, The ROC graph of odor responses induced during Hit and CR trials, and FA and CR trials from a representative mouse. L, Averaged traces of odor responses of Hit, FA, and CR trials across all animal–odor pairs. M, The auROCs for Hit versus CR trials and FA versus CR trials.

