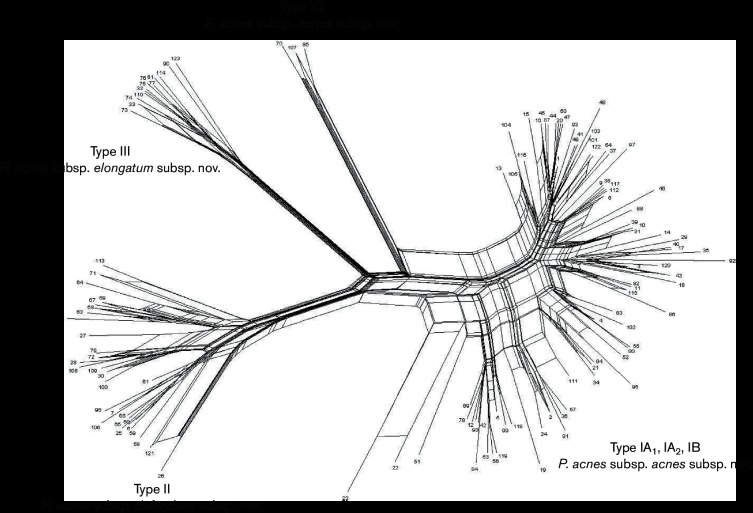
Fig. 2.
Neighbour-net split graph (SplitsTree v4.14.4) of allelic profiles from all STs currently represented in the MLST8 database (http://pubmlst.org/pacnes/), and covering all major genetic divisions (Huson & Bryant, 2006). A distance matrix was generated from the allelic profile data and saved in NEXUS format for input to SplitsTree. Parallelogram formations indicative of recombination/ reticulation events are evident within the major type I and II divisions.

