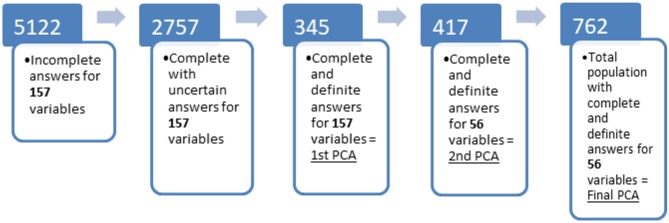
Figure 1.
Flow diagram showing population at different stages of analysis of the original survey. (1) total number of respondents including incomplete questionnaires; (2) number of questionnaires that were complete but had at least one uncertain response, i.e., “I don't know”; (3) number of questionnaires that were complete without any uncertain responses for any of the 157 variables of interest; (4) number of questionnaires that were complete and had definite responses for the 56 variables of interest which loaded on the components identified by the first PCA, but which had not been included in stage 3 due to uncertain answers in some of the other 101 items; (5) total number of questionnaires with complete and definite answers for the 56 behavioral variables identified at stage 3. Principal component analysis was performed on the populations represented by the last 3 stages.

