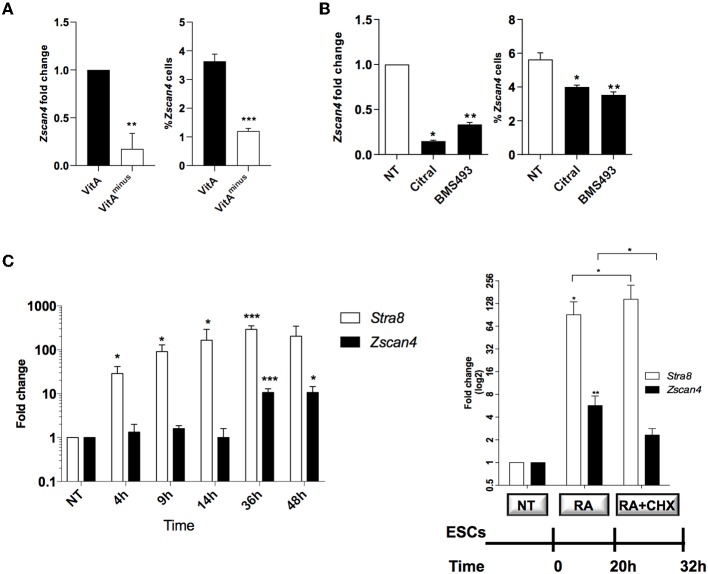
Figure 1.
Role of retinoids on Zscan4 cell population induction. (A) ESCs, cultured for 72 h in VitA and VitAminus condition, were analyzed by qPCR and cytofluorimetry. The Zscan4 expression levels were normalized to Gapdh expression and fold induction compared to VitA (left); the percentage of Zscan4+ cells was evaluated by flow cytometry analyses (right). (B) Zscan4 expression levels were assessed in ESCs cultured for 72 h with Citral or with BMS493 by qPCR, normalized to Gapdh expression and compared to NT (left); percentage of Zscan4+ cells was evaluated as in (A) (right). (C) ESCs, cultured in the presence of RA for 4, 9, 14, 36, and 48 h, were analyzed for Stra8 and Zscan4 expression (left). ESCs were grown in the presence of 1.5 μM RA for 32 h and in the absence/presence of 2 μg/ml cycloheximide (CHX) for 12 h (right). Stra8 and Zscan4 expression levels were assessed by qPCR and expressed as fold change respect to NT condition. The normalization was performed using the mean of three different housekeeping genes (Gapdh, Actin, 18S). The average and SEM of all the experiments were performed on the duplicate samples from three independent biological experiments and are shown: *p < 0.05, **p < 0.01, ***p < 0.001, in a Student's t-test.

