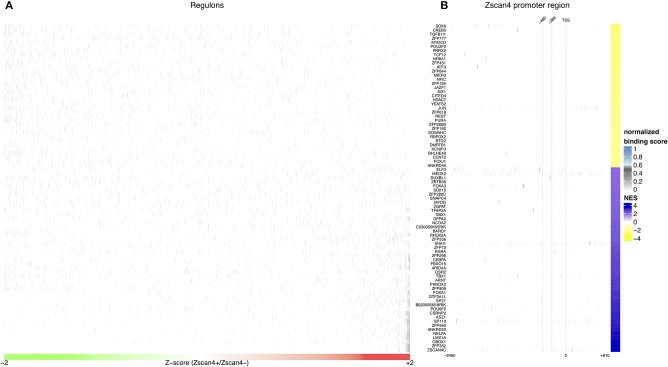
Figure 3.
In silico analysis of Zscan4 regulatory network. (A) Blue and Yellow colors indicate positive vs negative regulation of Master Regulators (MRs). Overall were found 80 significant master regulators. The figure shows, for each significant master regulator, the distribution of regulons respect to RA-Zscan4+ vs. RA-Zscan4− metastate phenotype. (B) The figure shows significant binding activity in the promoter region of Zscan4c.

