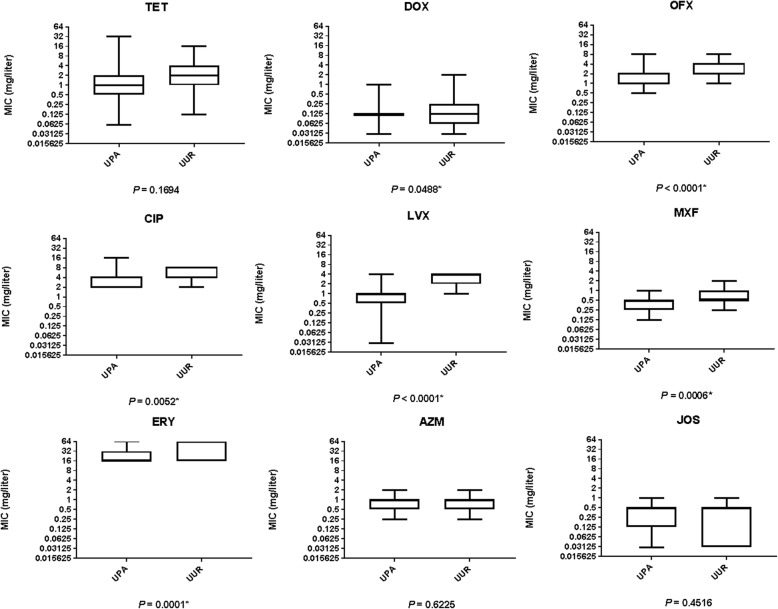
Fig. 1.
Boxplots comparing MICs for each antibiotic tested between U. parvum (UPA) and U. urealyticum (UUR) isolates. Interquartile and median MIC values are represented by boxes and centerline, respectively. Lower and upper whiskers represent minimum and maximum values, respectively. * Represents there is significant difference between the species

