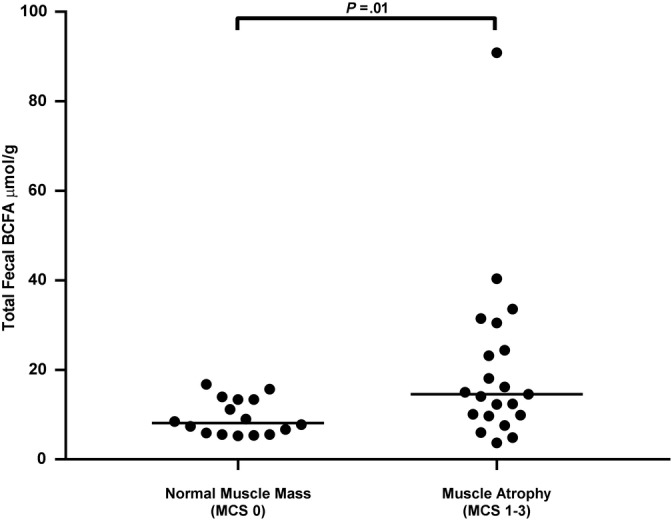
Figure 3.

Fecal total branched‐chain fatty acid (BCFA) concentrations in cats with normal muscle mass (muscle condition score [MCS] 0) and cats with muscle atrophy (MCS 1‐3). Cats with muscle atrophy had significantly higher fecal total BCFA concentration compared to cats with normal muscle mass (P = .01). Significance remained when data were analyzed without outlier (P = .02). Dot plot illustrates the median values
