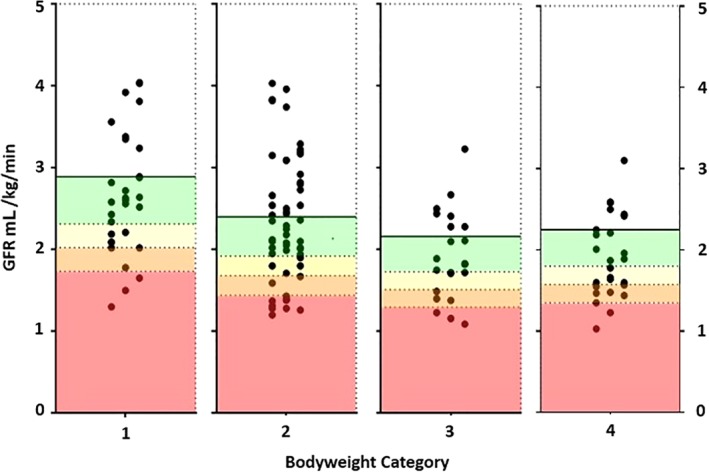
Figure 1.

Glomerular filtration rate (GFR) estimation results (mL/kg/min) represented graphically, separated by patient body weight Categories 1‐4. Each dot represents the GFR result from a patient. The area on each chart with a green background represents a GFR decrease of <20% from the mean GFR of the body weight category, the yellow background represents a GFR decrease of ≥20% but <30% from mean GFR, the orange background represents a ≥30% but <40% decrease in GFR from mean GFR, and the red background represents a ≥40% decrease in GFR from the mean GFR
