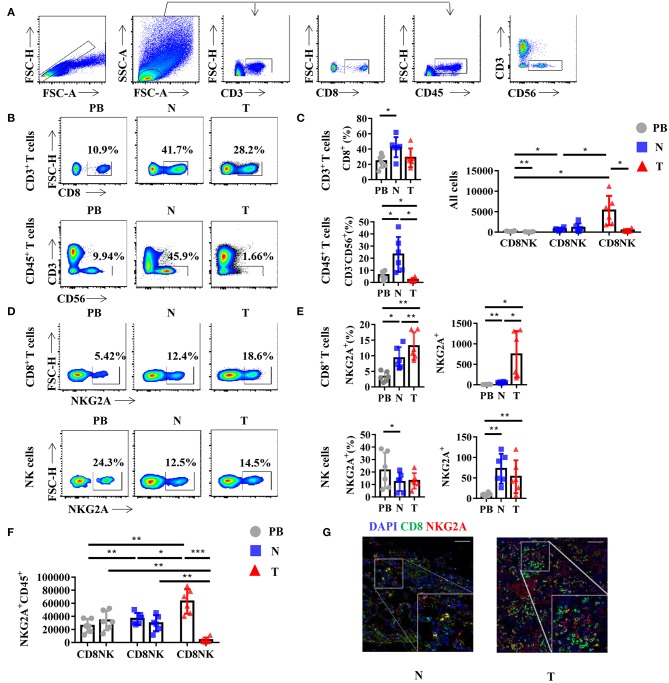
Figure 2.
NKG2A expression on CD8+ T cells and natural killer (NK) cells in lung cancer. (A) Representative gating strategy for the flow cytometric analysis of CD8+ T cells and NK cells in NSCLC. (B) Representative flow cytometric analysis of CD8+ T cells (upper panels) in CD3+ leukocytes and NK cells (lower panels) in the CD45+ leukocytes in non-small cell lung carcinoma (NSCLC). Cells from peripheral blood (PB; n = 6), N (healthy normal tissue adjacent to the tumor, n = 6), and T (tumor, n = 6) were analyzed by flow cytometry. Numbers in plots indicate the percent of cells in respective gates. (C) Bar diagram shows the percentages of CD8+ T cells (upper panels) in CD3+ leukocytes and NK cells (lower panels) in the CD45+ leukocytes and absolute numbers in all the cells in NSCLC. Data are shown as the mean ± SEM; n = 6; *p < 0.05; **p < 0.01. (D) Representative flow cytometric analysis of NKG2A expression on CD8+ T cells (upper panels) and NK cells (lower panels) in NSCLC. (E) Bar diagram shows the NKG2A expression on CD8+ T cells (upper panels) and NK cells (lower panels) and its absolute numbers in all the cells in NSCLC. Data are shown as the mean ± SEM; n = 6; *p < 0.05; **p < 0.01. (F) Bar diagram shows the absolute numbers of CD8+ T cells and NK cells in NKG2A+ CD45+ leukocytes. Data are shown as the mean ± SEM; n = 6; *p < 0.05; **p < 0.01; ***p < 0.001. (G) Paraffin sections from lung cancer patients (scale bars represent 50 μm for right inserts) were stained with anti-human NKG2A (red) and anti-human CD8 (green) for immunofluorescent (IF) staining. One of six independent experiments is shown. N (healthy normal tissue adjacent to the tumor, n = 6) and T (tumor, n = 6).

