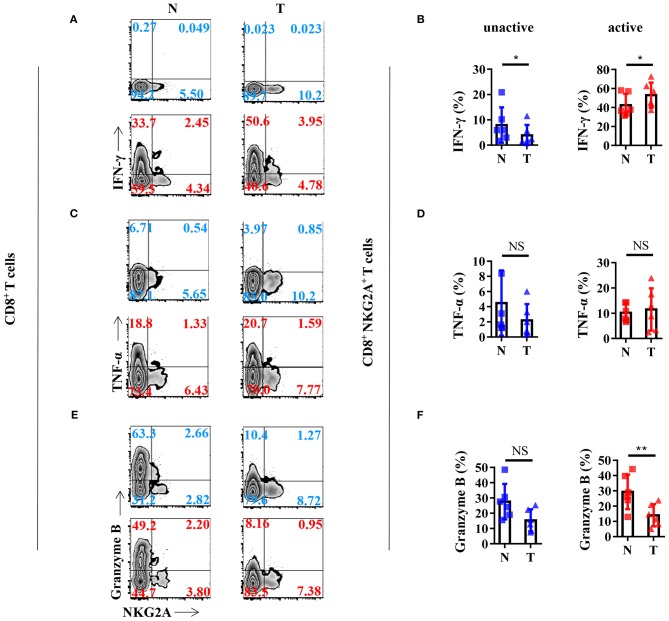
Figure 4.
Anti-tumor cytokine profile of the NKG2A+ CD8+ T cells. (A) Representative flow cytometric analysis of the expression of NKG2A and intracellular IFN-γ produced by CD8+ T cells with BFA and Monensin (blue) or with BFA, Monensin, PMA, and Ionomycin (red) in NSCLC. (B) Cells from N (healthy normal tissue adjacent to the tumor, n = 6) and T (tumor, n = 6) were analyzed by flow cytometry. Bar diagram summarizes the levels of intracellular IFN-γ produced by CD8+ NKG2A+ T cells. Data are shown as the mean ± SEM; n = 6; *p < 0.05. (C) Representative flow cytometric analysis of the expression of NKG2A and intracellular TNF-α produced by CD8+ T cells. (D) Bar diagram summarizes the levels of intracellular TNF-α produced by CD8+ NKG2A+ T cells. Data are shown as the mean ± SEM; n = 6; NS, no statistical significance. (E) Representative flow cytometric analysis of the expression of NKG2A and intracellular granzyme B produced by CD8+ T cells. (F) Bar diagram summarizes the levels of intracellular granzyme B produced by CD8+ NKG2A+ T cells. Data are shown as mean ± SEM; n = 6; NS, no statistical significance; **p < 0.01.

