
Figure 3.
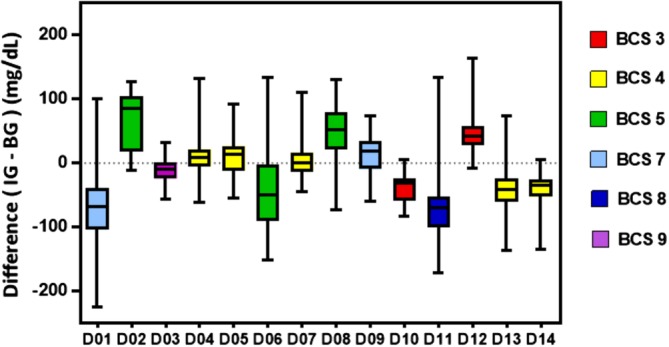
Inter‐patient variability (D = dog). Each patient is represented on the x‐axis with a box and whisker plot. The y‐axis represents the relative difference defined as IG − BG. BG, blood glucose; IG, interstitial glucose
Official websites use .gov
A
.gov website belongs to an official
government organization in the United States.
Secure .gov websites use HTTPS
A lock (
) or https:// means you've safely
connected to the .gov website. Share sensitive
information only on official, secure websites.
Inter‐patient variability (D = dog). Each patient is represented on the x‐axis with a box and whisker plot. The y‐axis represents the relative difference defined as IG − BG. BG, blood glucose; IG, interstitial glucose