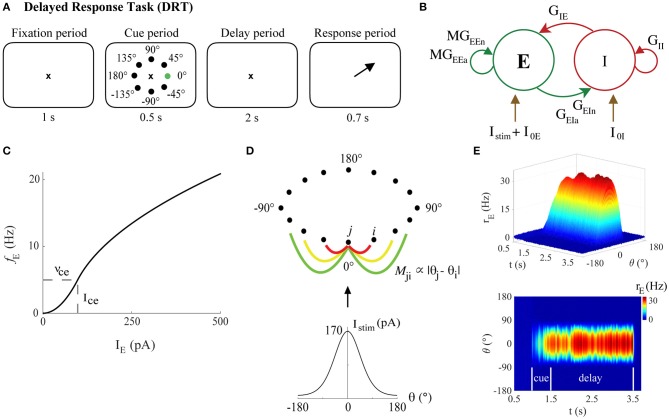
Figure 2.
The bump attractor model of the DRT. (A) The DRT includes fixation, cue, delay, and response periods of 1, 0.5, 2, and 0.7 s, respectively. The ×, black dots, and green dot, respectively, represent the fixation point, the 8 possible stimulus locations, and actual stimulus location (0°) in the simulations. Arrow indicates the saccade direction during the response period. (B) The recurrent excitatory-inhibitory network. (C) The f-I curve for young model excitatory neurons. (D) Ring connectivity among excitatory neurons. Mji is the connectivity matrix element between excitatory neurons j and i, depending on the difference between their preferred directions (θj and θi, respectively). Each neuron is strongly connected to its nearest neighbors (red line), with the connection strength decaying with distance (yellow and green lines). The neuron with preferred direction 0° receives the strongest stimulus current, which follows a Gaussian distribution centered at 0°, generating a bump of activity during the delay period (persistent activity tuned to the stimulus location) when excitation and inhibition in the network are well-balanced. (E) Sample DRT model output (side and top views) when the 0° stimulus location is encoded correctly: excitatory neuron FR vs. simulation time with neurons labeled by their preferred direction.

