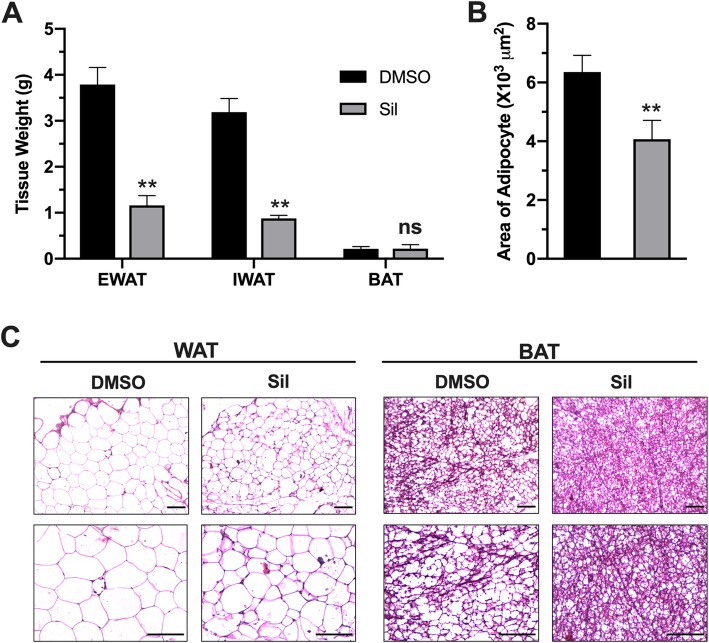
Fig. 2.
Silibinin treatment suppressed adipose tissue hypertrophy. (a) Average weights of epididymal WAT, inguinal WAT and BAT collected from treated and control animals. (b) Average areas of adipocytes in epididymal WAT of treated and control animals. (c) Representative images of H&E staining of WAT and BAT. Upper panels represent at 20X magnification, while lower panels represent 40X magnification (scale bars = 100 μm). Values in A and B represent averages ± SD (n = 5). *: P < 0.05, **: P < 0.01, ns: nonsignificant

