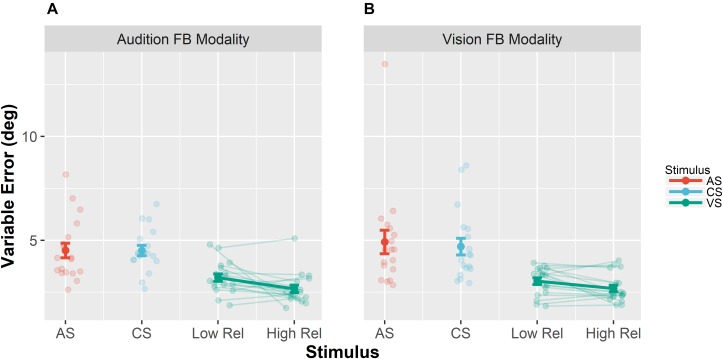
FIGURE 3.
Mean variable errors in the pretest. Variable errors were defined as absolute trial-wise deviation from the mean localization response, averaged across stimulus positions and participants. (A) Results when audition was the feedback modality. (B) Results for vision as the feedback modality. Each panel shows the variable error separately for the different stimuli [adapted sound (AS), control sound (CS), and visual stimulus (VS)]. Moreover, results for the VS are shown separately for the VS with low reliability (Low Rel) and high reliability (High Rel). Individual data are shown with light-colored points and lines, whereas sample averages are indicated by dark-colored points and bold lines. Paired data points (i.e., individual data from a single participant) are connected via lines. Error bars represent standard error of the mean. Mean values are depicted on top of each bar.

