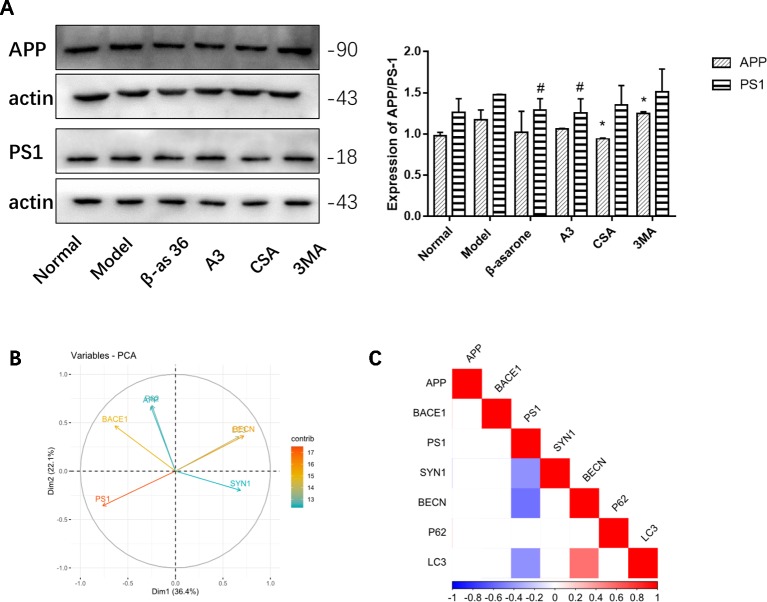
Figure 6.
The relationships of AD and autophagy factors. (A) Representative Western blotting bands using total protein extracts from the cells. Compared with model group, β-asarone and A3 both decreased the expression of PS1. β-asarone can promote the occurrence of autophagy and reduce PS1. (Compare with normal group ,#p < 0.05; compare with model group, *p < 0.05; one-away ANOVA, n=6). (B) The results of Canonical Correlation Analysis (CCA) showed a highly significant relationship between the pathology factor of AD and protein expression of autophagy. (C) P < 0.05 was not shown; basically P62 was negatively correlated with BECN (r = −0.68, P = 0.149) and LC3 (r = −0.119, P = 0.06); BECN and LC3 were positively related (r2 = 0.547, P = 0.006). PS1 was negatively correlated with BECN1 (r2 = −0.556, P = 0.005) and LC3 (r2 = −0.430, P = 0.040). Furthermore, PS1 was also negatively correlated with SYN1 (r2 = −0.424, P = 0.041) (Pearson correlation coefficient, n = 28).

