. 2019 Aug 20;10(41):9513–9529. doi: 10.1039/c9sc02526j

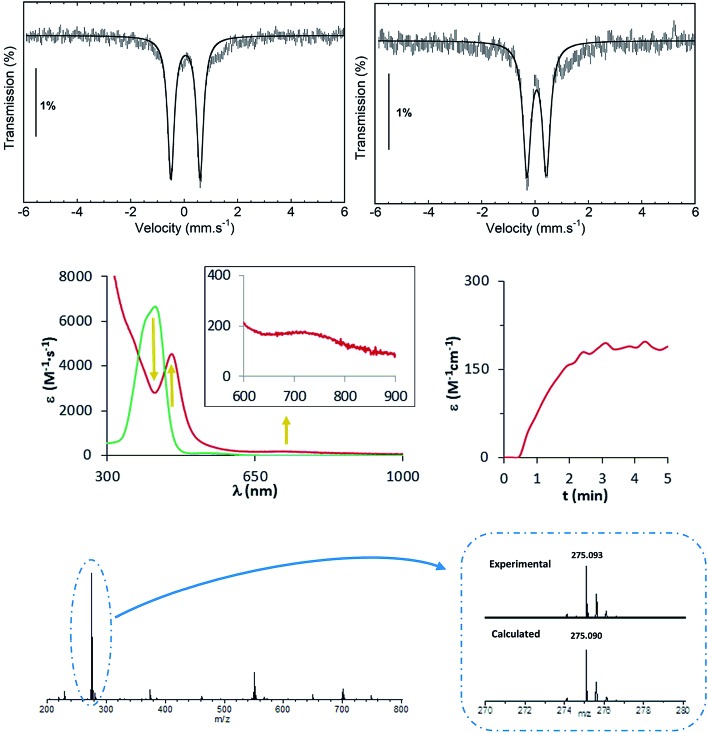
Fig. 1. Top, Mössbauer spectrum recorded at 80 K in zero-field of 1(IV) Created by potrace 1.16, written by Peter Selinger 2001-2019 NTs (left) in acetonitrile and 2(IV) Created by potrace 1.16, written by Peter Selinger 2001-2019 NTs (right) prepared in acetone. Experimental data are hatched bars and solid lines represent the contributions of 1(IV) Created by potrace 1.16, written by Peter Selinger 2001-2019 NTs and 2(IV) Created by potrace 1.16, written by Peter Selinger 2001-2019 NTs. Centre, UV-vis spectrum of oxidation of 1(II) to 1(IV) Created by potrace 1.16, written by Peter Selinger 2001-2019 NTs in CH3CN; kinetic trace shows the evolution of the λmax = 750 nm feature. Below, HR-MS spectrum of 1(IV) Created by potrace 1.16, written by Peter Selinger 2001-2019 NTs prepared in CH3CN exhibiting a base peak at m/z 275.09; inset show amplification of major peak for [FeIV(NTs)(MePy2tacn)]2+ species. Proper simulation of the peak requires inclusion of ≈10% of [FeIII(NHTs)(MePy2tacn)]2+ in the isotopic pattern corresponding to [FeIV(NTs)(MePy2tacn)]2+.

Fig. 1