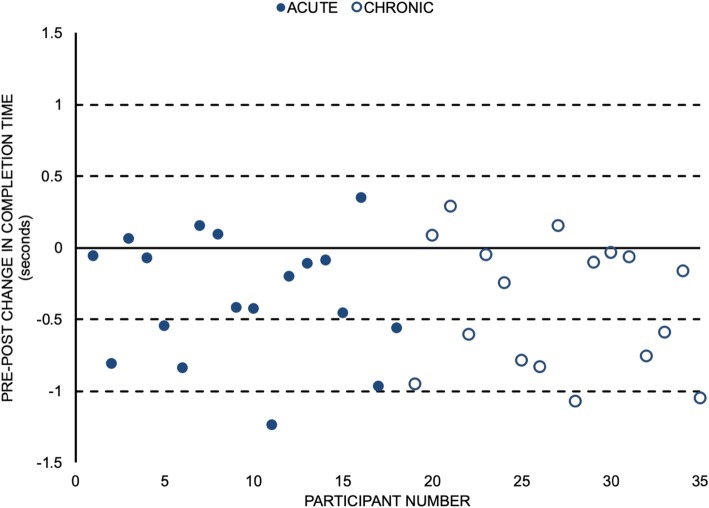
Fig. 4.
Change in time to complete the sit-to-stand task following the manual therapy intervention for individual participants. Closed circles represent acute low back pain participants, and the open circles represent chronic low back pain participants. The dashed lines represent integer multiples of approximations of the standard error of measurement from a 5 cycle sit-to-stand test: 0.5 s each

