Fig. 4.
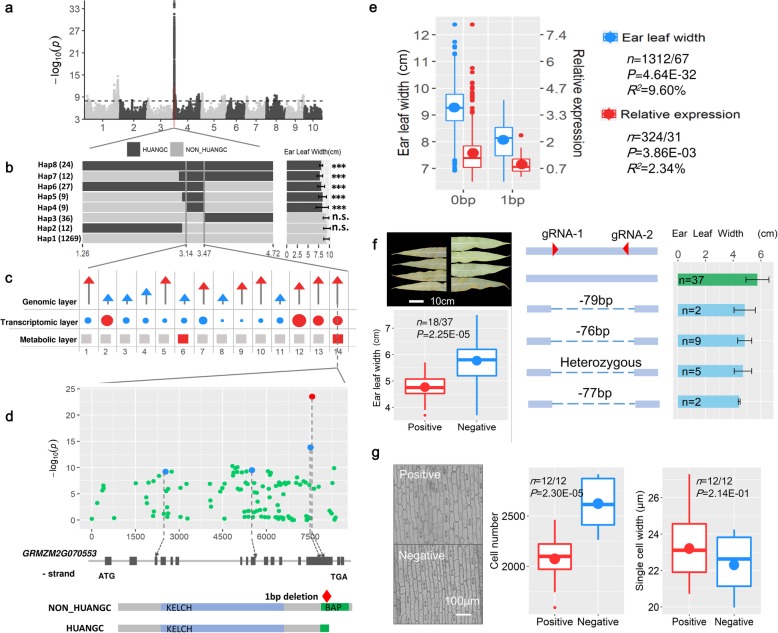
Integrating omics data empowers rapid gene mining for ear leaf width. a Manhattan plot of ear leaf width (ELW) based on sGWAS. The black dashed line represents the cutoff of 1.23E−8 based on adjusted Bonferroni correction. b Refinement of the major ELW QTL on the short arm of chromosome 4. The left panel illustrates the 7 major haplotypes (n > 8) at this QTL within the original 3.5-Mb interval. This test enabled the QTL to be delimited to a 334-Kb region with 14 genes. c Determination of candidate gene via omics data. The upper, middle, and bottom panels are the genomic, transcriptomic, and metabolic levels, respectively. The 14 genes are sequentially ordered based on physical positions (Additional file 9), and the genes associated with red symbols imply the candidate genes that influence the ear leaf at the different levels. d Local Manhattan plot within ZmGalOx1. Four type I polymorphisms were identified at this gene. The type I InDel is colored in red and SNPs are colored in blue; the bottom panel is a protein structure corresponding to the 1-bp InDel mutation. e Genetic impact of the 1-bp InDel on ELW and ZmGalOx1 expression. The P and R2 values were calculated using ANOVA. f Functional validation of ZmGalOx1 via CRISPR/Cas9. g Cytological experiment of CRISPR/Cas9 modified ZmGalOx1-carrying lines. The epidermal cells in the abaxial leaf surface for the CRISPR/Cas9 edited lines were observed. The P values are based on t test, and the error bars in bar plots represents the standard deviation in f and g

