. 2019 Sep 23;10(43):10010–10017. doi: 10.1039/c9sc03049b

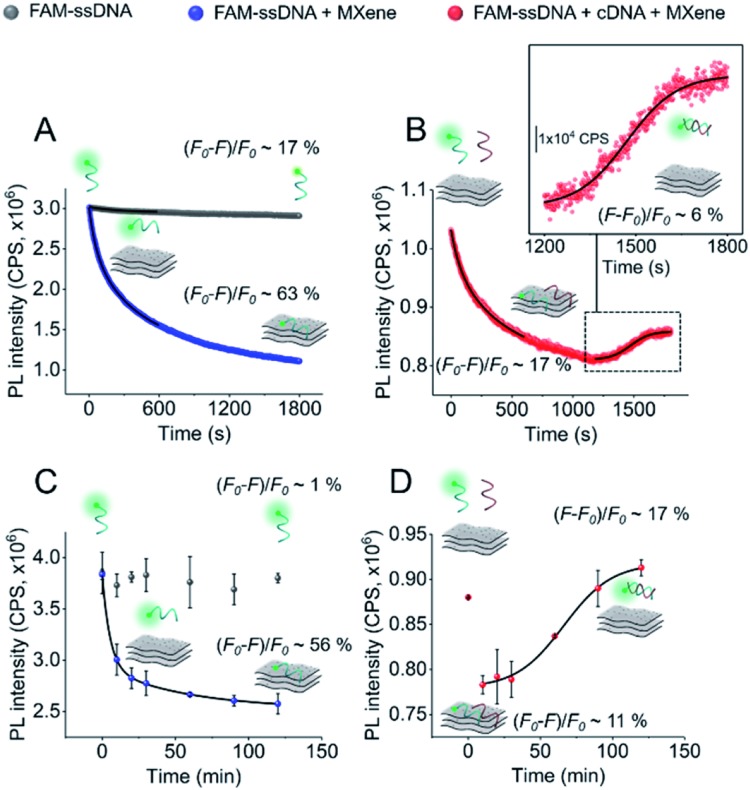
Fig. 4. Kinetic profiling of DNA–MXene interaction: (A and B) real-time fluorescence kinetics (step: 1 s; λex = 490 nm; λem = 520 nm); and (C and D) single-point measurements performed by incubating the samples (protected from light) and taking aliquots for measurements at 0, 10, 20, 30, 60, 90 and 120 min (λex = 490 nm; λem = 520 nm). (A and C) FAM-ssDNA and FAM-ssDNA (50 nM) + MXene (50 μg mL–1) with their respective fluorescence intensity changes ((F0F)/F0, where F0 is the intensity recorded at 0 s and F is the intensity recorded at 1800 s or 120 min). The fluorescence decays were fitted with double exponential functions. (B and D) FAM-ssDNA (50 nM) + cDNA (50 nM) + MXene displaying fluorescence intensity changes from 0–600 s for adsorption and 1200–1800 s or 10–120 min for desorption ((FF0)/F, where F is the intensity recorded at 1800 s or 120 min and F0 is the intensity recorded at 1200 s or 10 min). Inlet of (B) shows the region of fluorescence increase (1200–1800 s) fitted with a sigmoidal (Boltzmann) fit. The increase in fluorescence in plot (D) (10–120 min) was also fitted with a sigmoidal (Boltzmann) function. PL intensity was normalized in (A and B) to FAM-ssDNA's at time zero.

Fig. 4