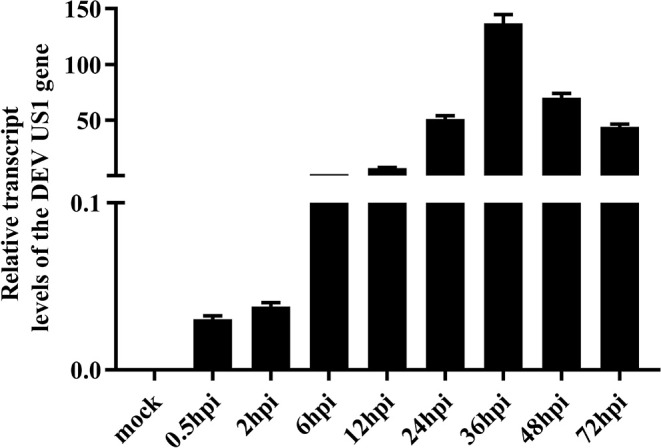
Figure 2.

Transcriptional analysis of the DEV US1 gene in infected cells with 10 MOI DEV; the average relative content of the DEV US1 gene transcripts was calculated at the indicated time points using GraphPad Prism 8.0 software. Each time point was examined in triplicate with the standard error.
