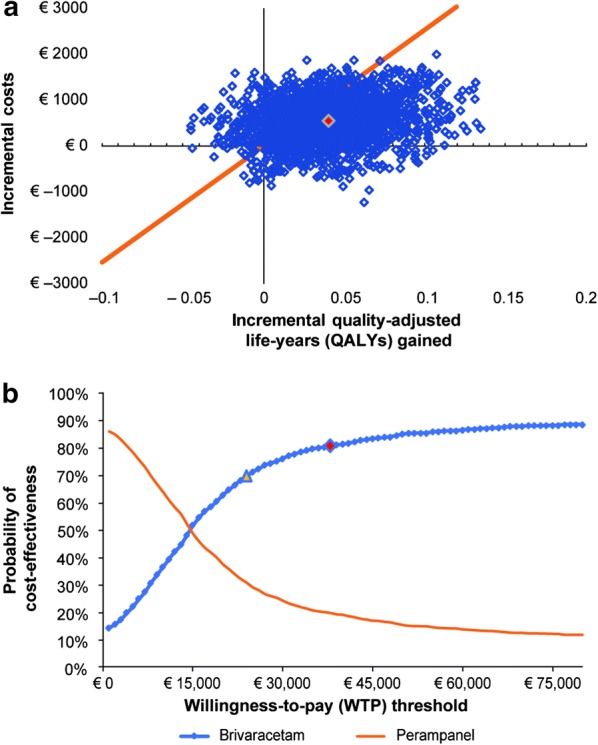
Fig. 2.

Results of the probabilistic sensitivity analysis. a Cost-effectiveness plane (CEP) and b cost-effectiveness acceptability curves (CEACs). Probabilistic sensitivity analysis results were generated using 2000 DESM iterations with cohorts of 500 patients. Marked point in CEP denotes the average results, and the line denotes the plausible willingness-to-pay threshold of €25,358 per quality-adjusted life-years (QALYs) gained. Marked points in CEAC denote the willingness to pay of €25,358 and €38,036 per QALY gained
