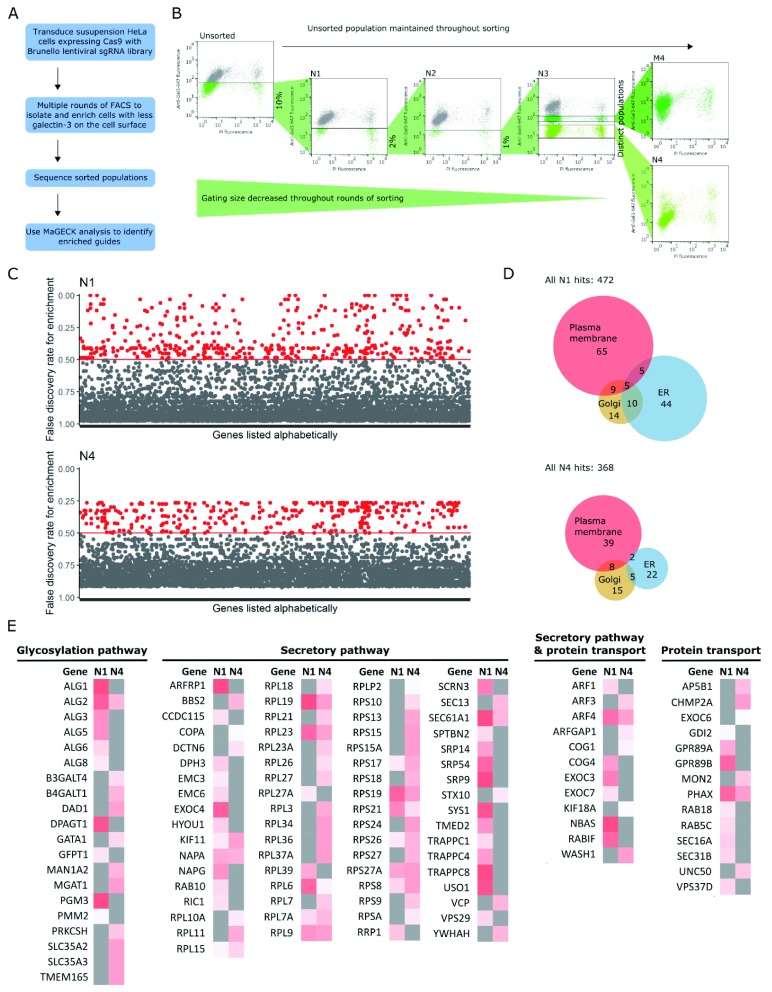
Figure 1. CRISPR screen.
( A) Workflow of genome-wide CRISPR screen. ( B) Multiple rounds of cell sorting by flow cytometry, decreasing gating percentage with progressive rounds, resulted in final populations of cells with a low level of galectin-3 on the cell surface. FACS plots are of samples taken after cells had been expanded after cell sorting, and show cell surface galectin-3 levels as measured by anti-galectin-3-647 fluorescence, and viability as measured by PI. Labels of FACS plots refer to population names: N1–4 = populations after negative sorts 1–4; M4, cells expressing medium level of galectin-3 after sort 4. ( C) Hits from populations N1 and N4; genes with a false discovery rate (FDR) <0.5 were defined as hit and shown in red. Genes with had guides that were enriched, but not significantly enriched (i.e. FDR ≥ 0.5), are shown in grey. ( D) Euler diagram showing the number of hits known to be associated with organelles in the secretory pathway. Many ER-resident hits are lost when progressing from sorts N1 to N4. ( E) Heat map of genes known to be in the secretory pathway, glycosylation pathway or involved in protein transport, as annotated by GO_Slim lists. Grey indicates an FDR greater than 0.5; hits are shown on a white-red scale, where darker red indicates a more significant FDR, closer to 0. The identity of hits changes significantly from populations N1 to N4.

