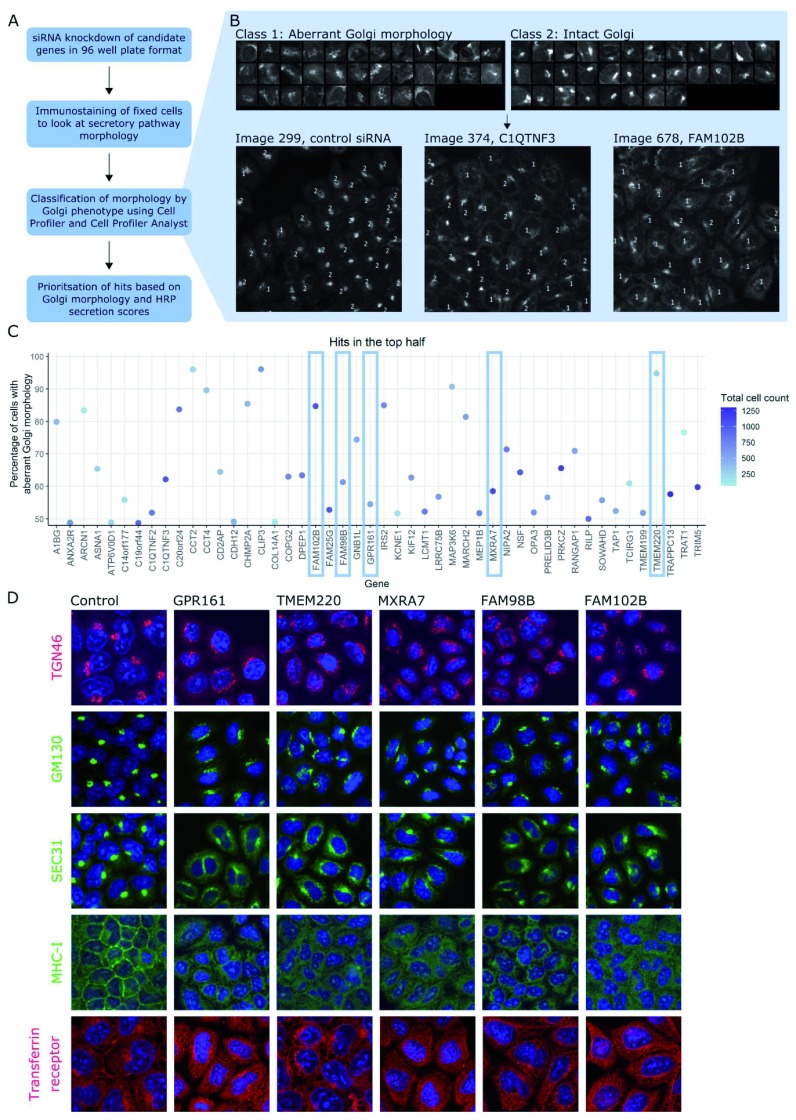
Figure 3. Further secondary screen for altered Golgi morphology.
( A) Workflow of Golgi morphology screen. ( B) Training set used to train the CellProfiler Analyst (CPA) classifier to distinguish between fragmented and intact Golgi. Using this training set, sensitivity was 77% for fragmented Golgi class and 82% for the intact Golgi class. Examples of control and test images classified using CPA are also shown. Cells with fragmented Golgi are labelled with 1; cells with intact Golgi are labelled with 2. ( C) Percentage of cells with fragmented Golgi for the top 48 hits from tertiary screen. Hits are arranged alphabetically and coloured by cell count, with darker blue spots representing more confluent wells. Five of these hits were further characterised, indicated with blue rectangles. ( D) Immunostaining of HeLa cells (original magnification 20x) treated with siRNA to knockdown each of the five genes indicated above the images. Cells were stained with the antibodies against the proteins indicated in green or red on the left. For all images, DAPI staining is shown in blue.

