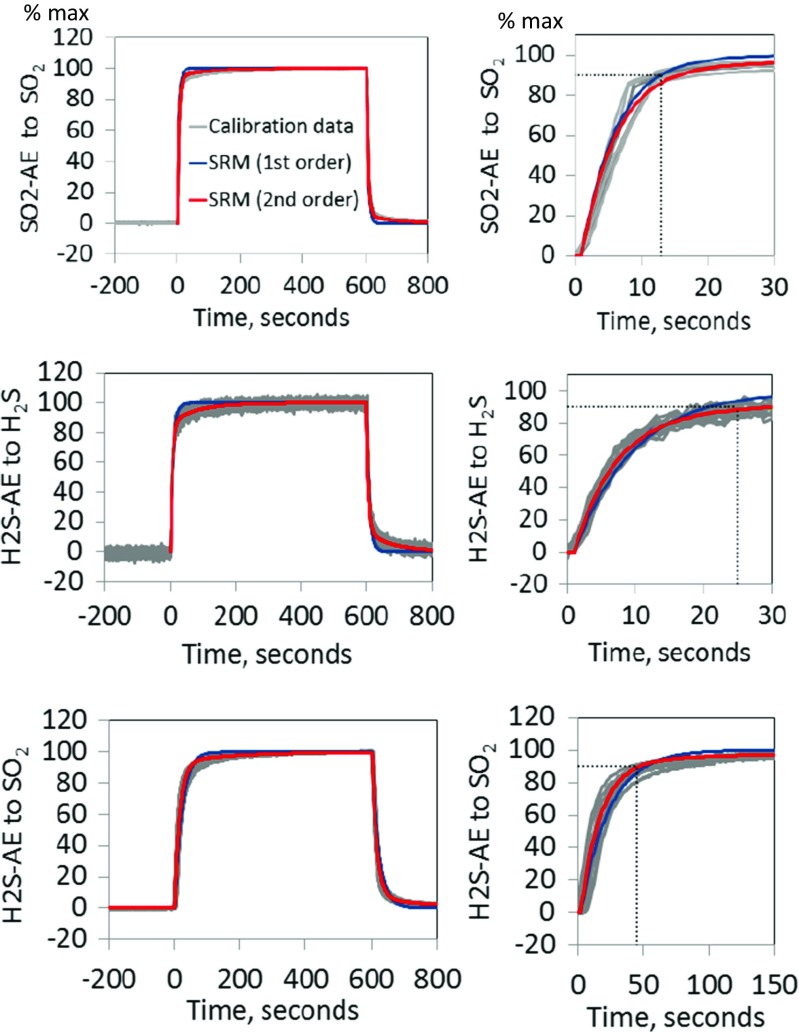
Fig. 3.
Laboratory calibrations (in batches of same sensor type) quantifying SO2-AE and H2S-AE sensor response to and following a 10 min gas exposure (between 0 and 600 s). The gas abundances used were 400 ppmv SO2, 20 ppmv H2S and 200 ppmv SO2, respectively. Sensor signals have been normalized to reach 100% at the end of the 10 min exposure. Sensor response models (SRM) of first- (blue) and second-order (red) are fitted to the sensor signal. The sensor T90 is also shown (dotted black lines), Table 1. Sensor response to and recovery from the gas pulse are similar

