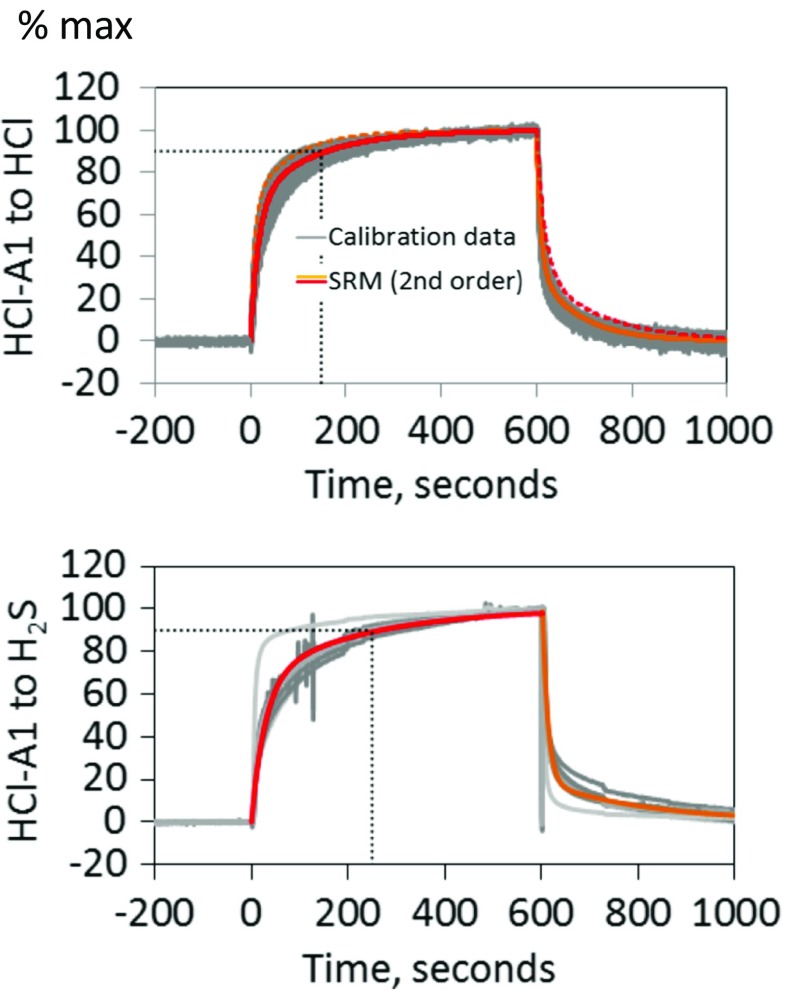
Fig. 4.
Laboratory calibrations (in batches of the same sensor type) quantifying HCl-A1 sensor response to and following a 10 min gas exposure (between 0 and 600 s). The gas abundances used were 25 ppmv HCl and 20 ppmv H2S. Sensor signals have been normalized to reach 100% at the end of the 10 min exposure. Sensor response models (SRM) are also shown, where the response to the gas pulse (red) is somewhat slower than recovery following the gas pulse (orange); see SRM parameters in Table 1. The sensor T90 is also shown (dotted black lines)

