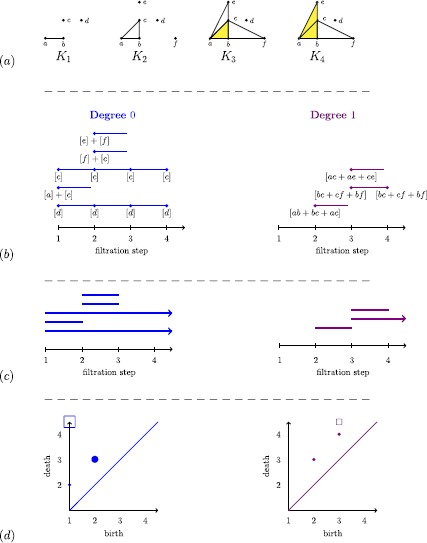
Figure 5.

Example of persistent homology for a finite filtered simplicial complex. (a) We start with a finite filtered simplicial complex. (b) At each filtration step i, we draw as many vertices as the dimension of (left column) and (right column) . We label the vertices by basis elements, the existence of which is guaranteed by the Fundamental Theorem of Persistent Homology, and we draw an edge between two vertices to represent the maps , as explained in the main text. We thus obtain a well-defined collection of disjoint half-open intervals called a ‘barcode.’ We interpret each interval in degree p as representing the lifetime of a p-homology class across the filtration. (c) We rewrite the diagram in (b) in the conventional way. We represent classes that are born but do not die at the final filtration step using arrows that start at the birth of that feature and point to the right. (d) An alternative graphical way to represent barcodes (which gives exactly the same information) is to use persistence diagrams, in which an interval is represented by the point in the extended plane , where . Therefore, a persistence diagram is a finite multiset of points in . We use squares to signify the classes that do not die at the final step of a filtration, and the size of dots or squares is directly proportional to the number of points being represented. For technical reasons, which we discuss briefly in Section 5.4, one also adds points on the diagonal to the persistence diagrams. (Each of the points on the diagonal has infinite multiplicity.)
