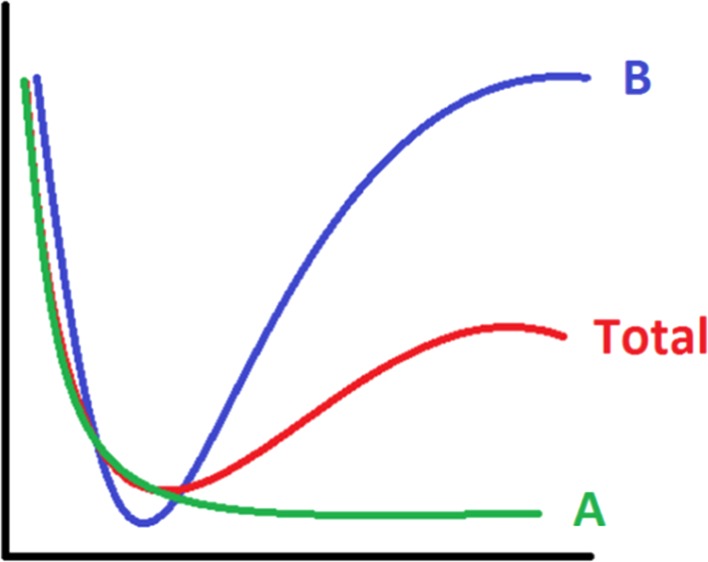
Fig. 2.
Energy profiles of two candidate energy contributions, A and B, each of which strives to “mimic” the total energy profile as best as possible. It is observed that RMSE(A, total) ≪ RMSE(B, total). However, the profile of B captures better the overall (broad) behaviour of the total curve in that both B and the total energy are wells, while A is not

