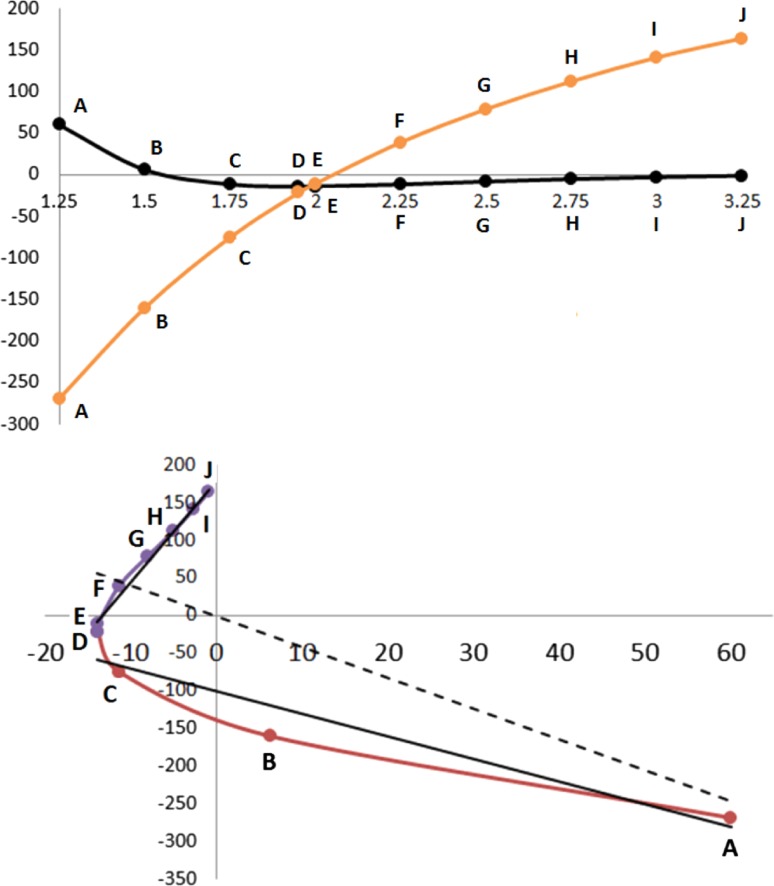
Fig. 4.
Energy profiles for the water dimer: (top) the total energy (black) and the V cl(H3, O4) energy contribution (orange) controlled by the O···H distance in Å; (bottom) the correlation between the two energies in the top panel. The dashed line shows the poor linear fit if the whole curve is considered, while much better correlations are obtained after segmentation into a purple and a red curve

