Fig. 2.

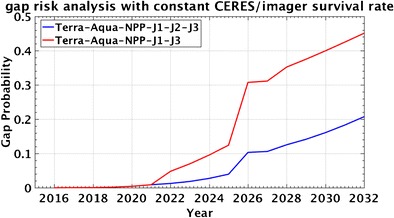
Probability of a data gap in the global satellite ERB time series from present through a given year. The blue curve includes all ERB instruments flying or planned, whereas the red curve excludes the ERB instrument on the J2 satellite

Probability of a data gap in the global satellite ERB time series from present through a given year. The blue curve includes all ERB instruments flying or planned, whereas the red curve excludes the ERB instrument on the J2 satellite