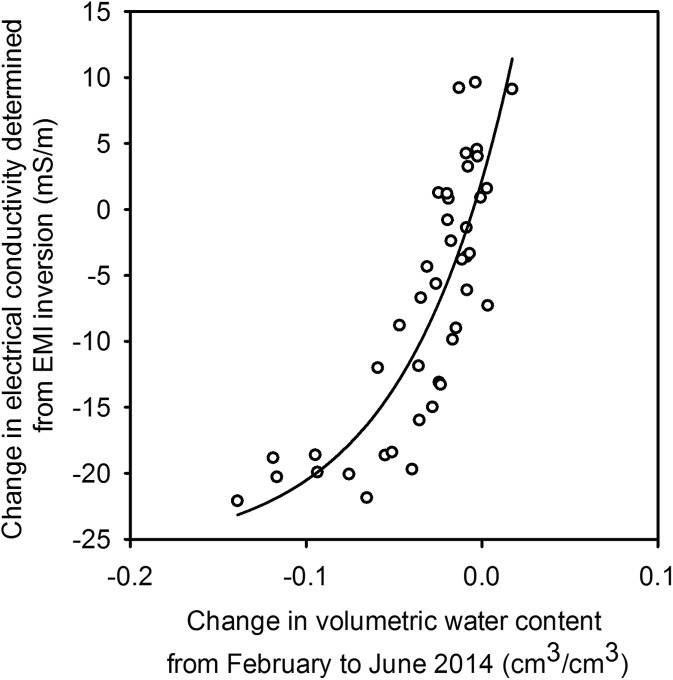
Fig. 4.
Change in electrical conductivity between February and June 2014, determined from the inversion of EMI data, plotted against the change in water content measured with a neutron probe. These data were obtained from Broadmead field. A negative change in volumetric water content indicates relative soil drying. Symbols represent the individual data points from the different depths measured by the neutron probe and the corresponding conductivity changes determined from the inversion of EMI data

