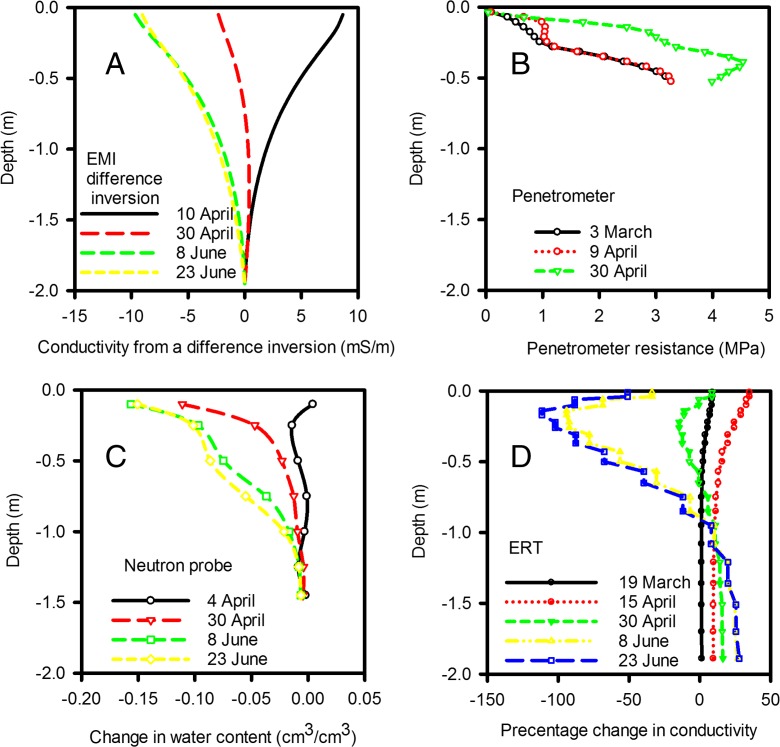
Fig. 5.
These data were collected in 2015 on Warren field. The effect of temporal patterns in soil drying with depth on data determined from the inversion of ERT (D) and EMI (A) data, penetrometer measurements (B) and neutron probe (C) measurements is shown. EMI and ERT data are obtained from the inversion routine that provides a continuous distribution over depth. We only applied the EMI inversion routine to data sets when the six measured apparent conductivities were significantly different. In 2015 these data were not significantly different and EMI data represent the inversion applied to the average apparent conductivities, taken across all the wheat genotypes. Neutron probe data also showed that there was no significant difference in water profile between wheat genotypes and again the data plotted is the average for all wheats. The penetrometer data are replotted from Gao et al. (2016a). Both Penetrometer and ERT data did show significant genotypic effects (P < 0.001), but here we show the average taken across all wheat lines to illustrate the temporal effects. All symbols represent the genotypic grand mean from ANOVA

