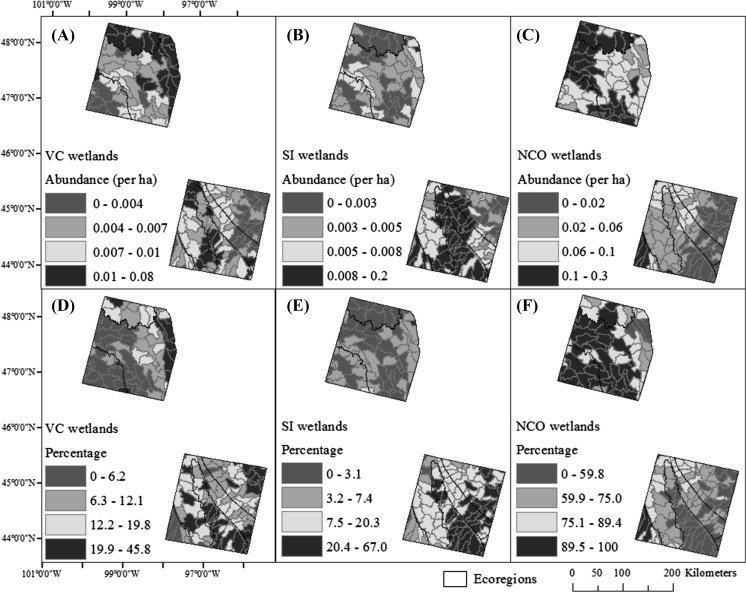
Fig. 6.
Differences in the spatial pattern of VC (variably connected), SI (stream intersect), and NCO (no connection observed) wetland abundance by wetlands per ha (a, b, c) and relative percentage (d, e, f), where percentage is calculated from the sum of VC, SI and NCO wetlands. Category divisions represent quantiles

