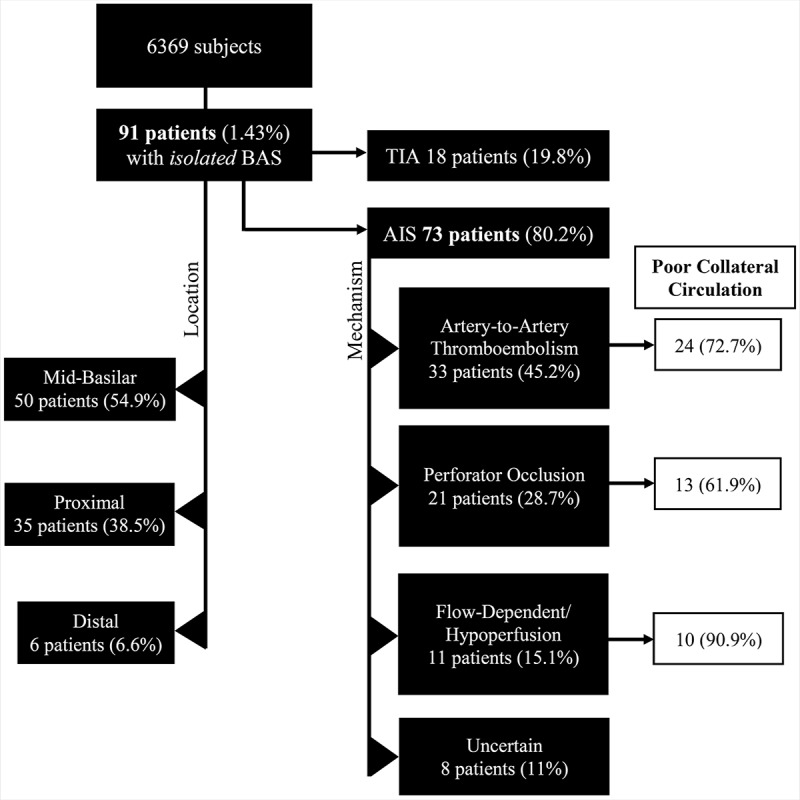
Figure 4.

Flow chart of the cohort by presentation and location of the stenosis. AIS, acute ischaemic stroke; BAS, basilar artery stenosis; TIA, transient ischaemic attack.

Flow chart of the cohort by presentation and location of the stenosis. AIS, acute ischaemic stroke; BAS, basilar artery stenosis; TIA, transient ischaemic attack.