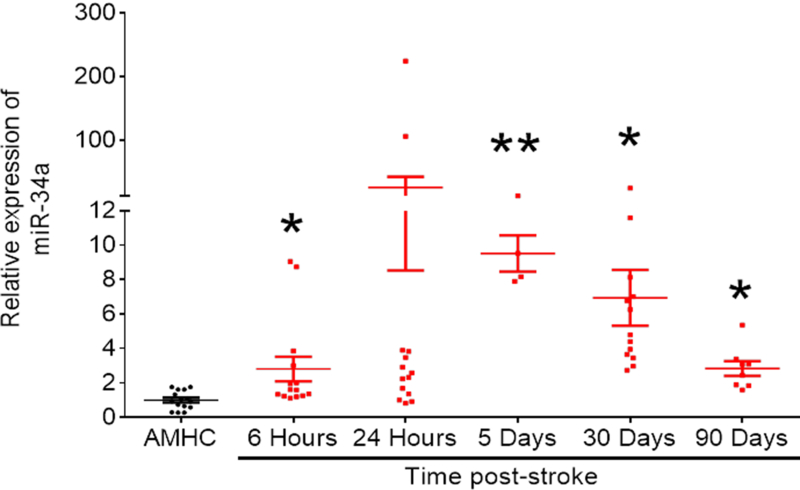
Figure 1: Analysis of miR-34a expressed in the serum of stroke patients compared to controls.

miR-34a was significantly upregulated in the serum of stroke patients at several reperfusion times (6 hours, 5, 30 and 90 days). Data were pooled from both male and female patients. Age matched healthy controls (AMHC) were used. Expression of spike-in C. elegans miR-39 was used to calculate relative fold change in miR-34a expression levels. All reactions were analyzed by qRT-PCR performed in triplicates. Data are expressed as mean ± S.D. Sample sizes were reflected by dot plots; One-way ANOVA followed by post-hoc Tukey’s test. *, p < 0.05; **, p < 0.01. (Lewis, et al., unpublished observations)
